
Home » Lead Source and Marketing Attribution Tracking in Nimble CRM
You send your leads to Nimble CRM and want to attribute each lead to its marketing source.
You may have already tried several solutions, but you still can’t get clean attribution because:
In this article, I’ll show you a robust solution to automatically track lead source (and other marketing attribution data) in Nimble CRM for 100% of your leads.
LeadSources is a marketing attribution software that tracks attribution data for each lead you generate.
When a user converts into a lead, LeadSources injects this attribution data into Nimble CRM.
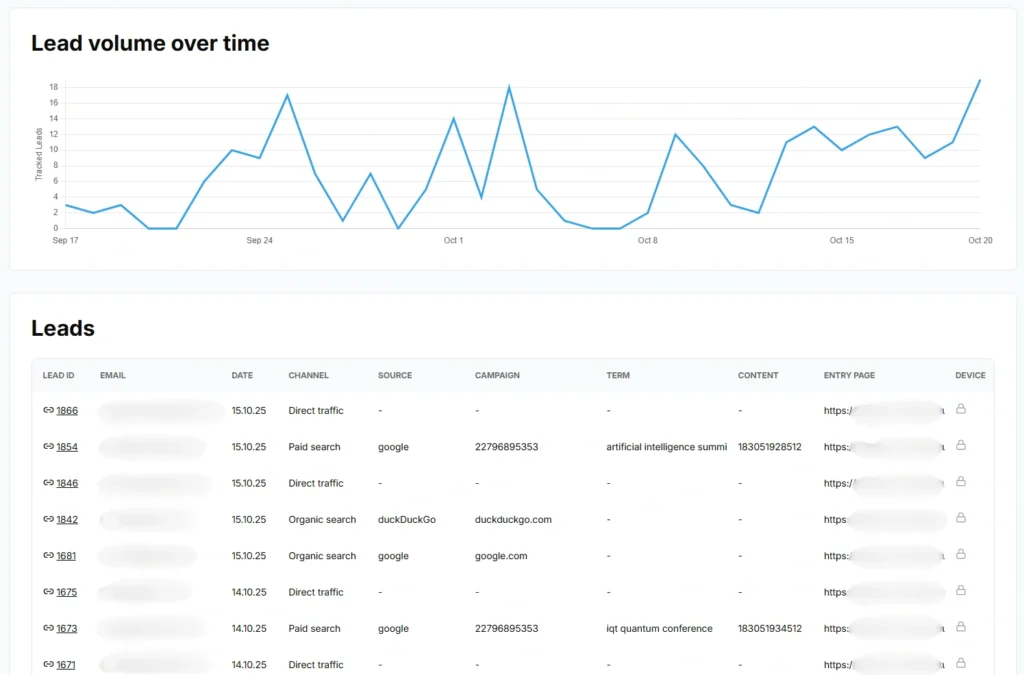
Every lead comes with a rich lead source report including: marketing attribution data, UTM parameters, user journey, and device data.
LeadSources attribution works for all channels, both paid (PPC, SMM, affiliates, etc.) and organic (SEO, social, PR, emailing, etc.).
LeadSources relies on a robust attribution algorithm to ensure attribution for 100% of the leads:
Now, imagine a user clicks on your PPC ad and leaves your site without filling out your form.
Four months later, the same user returns to your site from a Google organic search and completes your form.
LeadSources remembers all previous visits and provides a complete marketing attribution report for every session that occurred before the form submission.
Tracking the full lead journey helps you understand the role each marketing channel plays in your lead generation strategy.
That ad that seemed ineffective because it didn’t generate leads might actually be the first touchpoint of your most valuable leads. The full lead journey simply wasn’t visible before.
Sign up to LeadSources (we offer a 14-day free trial).
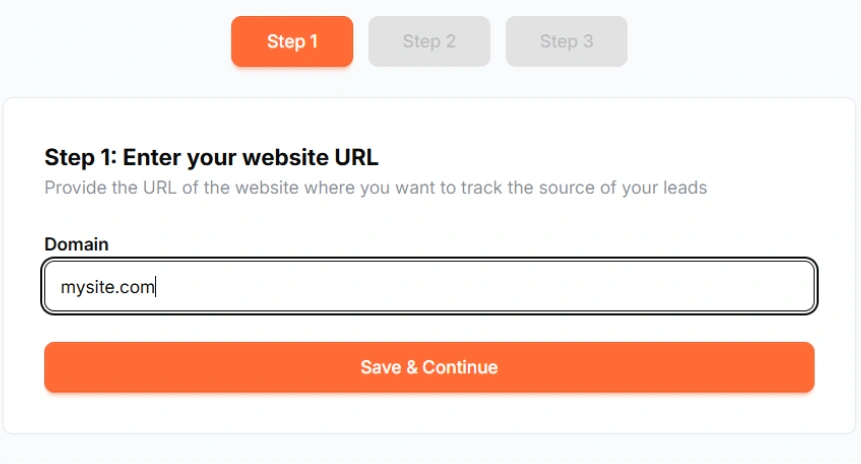
Enter the URL of the website you want to track.
Copy and paste your LeadSources tracking code into the <head> section of your website.
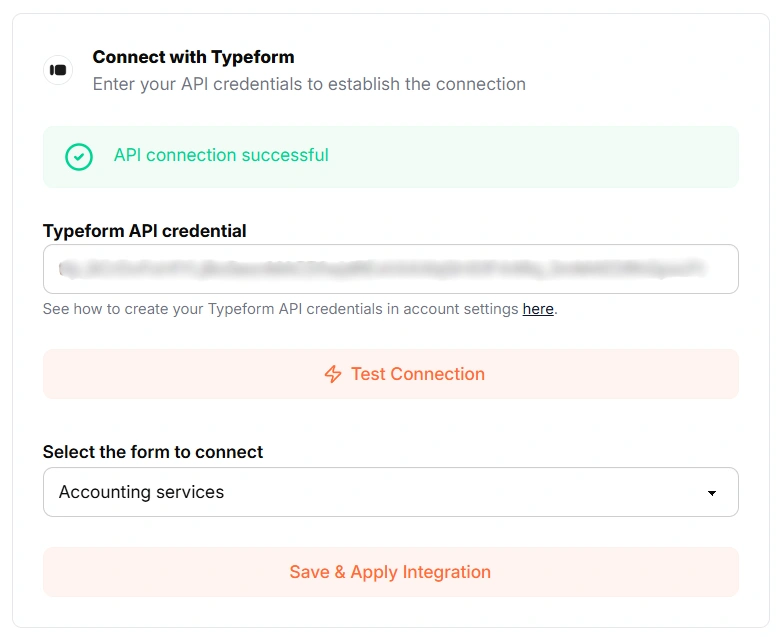
Connect your form in one click with our native integrations.
Then, select the form you want to track.
LeadSources will start tracking the source and journey of every lead you generate.
You can send to Nimble CRM the following last-click data for each lead generated:
Yes. You can send the attribution data collected by LeadSources to Nimble CRM.
This requires an extra setup described in the guides below:
LeadSources collects the following lead source and attribution data for each lead you generate:
You can send the following last-touch attribution data to Nimble CRM:
Start your free trial today and track the full source of every lead throughout their journey.

Automated page speed optimizations for fast site performance
