
TL;DR
- Markov Chain Attribution calculates each touchpoint’s contribution by measuring conversion probability changes when that touchpoint is removed from the customer journey.
- Uses probabilistic state transition modeling to evaluate sequential dependencies between channels—revealing which touchpoints act as critical conversion bridges vs. passive exposures.
- CMOs implementing Markov models achieve 18–32% more accurate channel valuations compared to rule-based attribution, identifying undervalued mid-funnel interactions that drive 22–35% of actual conversions.
What Is Markov Chain Attribution?
Markov Chain Attribution is a probabilistic data-driven attribution model that assigns conversion credit by calculating each touchpoint’s removal effect.
Unlike rule-based models that apply fixed credit splits, Markov chains map every possible customer journey as a series of state transitions. Each touchpoint represents a state—Paid Search, Email, Organic, Display—with transition probabilities calculated from actual journey data.
The model answers: If we removed Channel X from all journeys, how much would conversion probability drop? That difference equals the channel’s true attribution value.
Core Mechanism: Build a transition matrix showing probability of moving from one touchpoint to another. Calculate baseline conversion rate with all channels active. Remove one channel, recalculate conversion rate. The delta is that channel’s attributed value.
This approach captures sequential dependencies that rule-based models miss. For B2B pipelines with 8–14 touchpoints across 60–180 day cycles, Markov models reveal which specific touchpoint sequences drive conversions—not just which channels appear in winning journeys.
Test LeadSources today. Enter your email below and receive a lead source report showing all the lead source data we track—exactly what you’d see for every lead tracked in your LeadSources account.
How Markov Chain Attribution Works
Markov attribution operates through four mathematical stages that transform journey data into removal-effect valuations.
Stage 1: Journey Mapping and State Definition
Every customer path becomes a sequence of states with a defined start, touchpoint transitions, and end state (conversion or null).
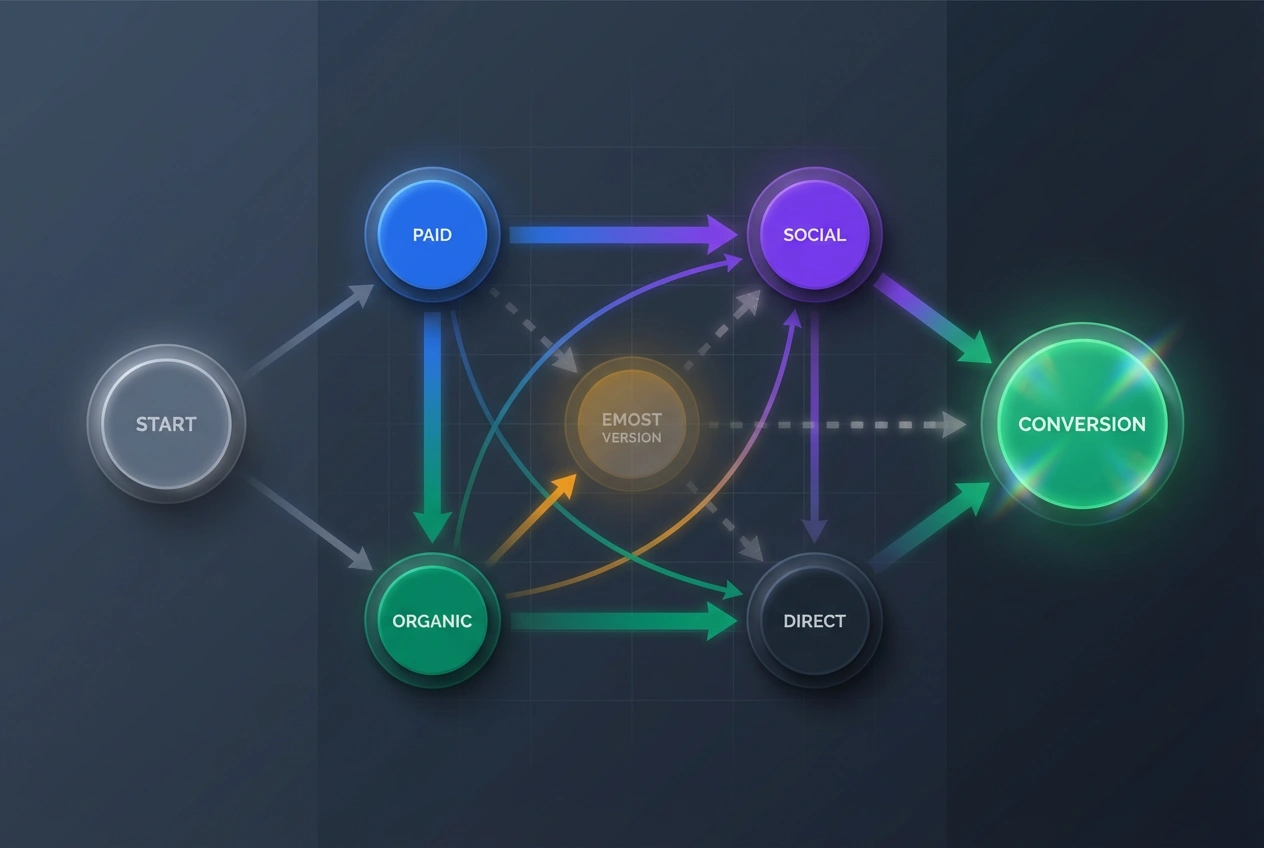
State Structure: START → Paid Search → Email → Organic → CONVERSION represents one journey path. Each touchpoint is a node; each progression is an edge with a calculated transition probability.
For enterprise implementations, typical state counts: 8–15 active marketing channels, 20–40 unique touchpoint sequences accounting for 80%+ of conversions, 150–500 total unique journey paths in dataset.
Stage 2: Transition Probability Calculation
Calculate likelihood of moving from State A to State B based on observed journey data.
Formula: P(A→B) = Count of A→B transitions ÷ Total transitions from A. Example: If 100 users hit Email after Paid Search, and 400 total users transitioned from Paid Search, then P(Paid Search→Email) = 100÷400 = 0.25 or 25%.
Build complete transition matrix showing all channel-to-channel probabilities. This matrix forms the Markov chain foundation—a probabilistic map of customer movement through your marketing ecosystem.
Stage 3: Baseline Conversion Probability
With all channels active, calculate total conversion probability by tracing all possible paths from START to CONVERSION.
Calculation Method: For each unique path (e.g., START→Social→Email→CONVERSION), multiply all transition probabilities along that path. Sum probabilities across all conversion paths to get baseline conversion rate.
This baseline represents your current marketing mix’s total conversion effectiveness—the benchmark against which removal effects are measured.
Stage 4: Removal Effect and Credit Allocation
Remove one channel completely. Recalculate conversion probability without that channel’s transitions. The drop in conversion probability equals that channel’s attributed value.
Attribution Value Formula: Channel Attribution = (Baseline Conversion Probability – Removed Channel Conversion Probability) ÷ Total Attribution Value Across All Channels. Normalize to 100% total credit distributed across touchpoints.
Channels with high removal effects—those whose absence significantly reduces conversion probability—receive proportionally higher attribution credit regardless of their position in the funnel.
Markov vs. Other Attribution Models
Markov chain attribution differs fundamentally from rule-based and other algorithmic approaches in both methodology and output characteristics.
| Model Type | Credit Logic | Sequential Dependencies | Data Requirements | Output Stability |
|---|---|---|---|---|
| Last-Click | 100% to final touchpoint | None—ignores journey | Minimal (only last touch) | Highly stable |
| Linear | Equal credit split | None—position-agnostic | Moderate (full journey) | Highly stable |
| Time Decay | Exponential decay curve | None—time-based only | Moderate (timestamps) | Stable |
| Shapley Value | Marginal contribution (all permutations) | None—order-independent | High (full journey set) | Stable but computationally expensive |
| Markov Chain | Removal effect (probabilistic) | Yes—captures sequence patterns | Very high (large journey dataset) | Sensitive to data volume changes |
Key Distinction: Markov chains are the only common attribution model that explicitly captures sequential dependencies. If users who see Display after Paid Search convert at 3.2% but users who see Paid Search after Display convert at 1.8%, Markov attributes different values to each sequence. Linear and Time Decay miss this entirely.
Shapley Value also uses algorithmic logic but evaluates marginal contribution across all possible orderings (factorially complex). Markov focuses on observed sequential probabilities—faster computation but requires sufficient data volume per transition path.
Implementation Framework
Deploying Markov attribution requires structured data preparation, model calibration, and validation against business objectives.
Phase 1: Data Infrastructure (Weeks 1–4)
Journey Data Requirements: Minimum 500–1,000 completed conversion journeys for stable model. 2,000+ journeys for confidence in channel-specific removal effects. Each journey requires: User ID (deterministic or probabilistic), Ordered list of touchpoints with timestamps, Conversion outcome (binary: converted or null), Channel metadata (source, medium, campaign, creative).
Data Quality Thresholds: <5% duplicate user paths (session deduplication), <10% missing channel attribution in journeys, 80%+ deterministic user identification (cookie/device ID match rate), Consistent timestamp precision (minute-level minimum, second-level preferred).
Store in cloud data warehouse with proper schema: journey_id, user_id, touchpoint_sequence array, touchpoint_timestamps array, conversion_flag, conversion_value.
Phase 2: Model Configuration (Weeks 5–8)
Parameter Calibration: Attribution window: 30–90 days for B2B (longer sales cycles), 7–30 days for B2C. Path length limits: Cap at 20 touchpoints (diminishing signal beyond this). Channel grouping: Consolidate low-volume channels (<2% of total touchpoints) into "Other" to prevent sparse data issues.
Transition Matrix Construction: Calculate transition probabilities for all observed channel pairs. Smooth probabilities for rare transitions using Laplace smoothing (add-one smoothing) to prevent zero-probability scenarios. Validate that outbound probabilities from each state sum to 1.0 (stochastic requirement).
Phase 3: Removal Effect Calculation (Weeks 9–12)
Baseline Establishment: Run full model with all channels active. Calculate total conversion probability across all paths. This becomes your 100% baseline for attribution distribution.
Sequential Channel Removal: For each channel: Remove all transitions involving that channel, Recalculate conversion probability, Delta = Baseline – Removed State Conversion Probability. Normalize deltas across all channels to sum to 100%.
Validation Check: Sum of all channel attribution values must equal total actual conversions. If Markov attributes 2,500 conversions but actual conversions = 2,200, model is over-crediting (likely due to multi-path interactions). Requires recalibration or transition probability smoothing.
Phase 4: Integration and Monitoring (Month 4+)
CRM Attribution Sync: Map Markov attribution percentages to lead source fields in CRM. For multi-touch leads, append fractional credit: Lead Source Primary = Highest attributed channel (40%+ credit), Lead Source Secondary = Second-highest channel, Markov Attribution Array = Full credit distribution JSON.
Model Refresh Cadence: Rebuild transition matrix monthly for B2C (fast-moving campaigns). Rebuild quarterly for B2B (slower journey evolution). Trigger immediate rebuild if: Channel mix changes >20%, New channels added/removed, Conversion rate shifts >30%.
ROI Impact and Performance Benchmarks
Organizations implementing Markov attribution consistently identify 18–32% more accurate channel valuations, uncovering mid-funnel performance that rule-based models systematically undervalue.
Attribution Accuracy Gains
Channel Revaluation: Mid-funnel channels (email nurture, content syndication, webinars) receive 22–35% more credit under Markov vs. last-click. Lower-funnel channels (branded search, direct, retargeting) receive 40–55% less credit. Top-funnel awareness channels see 8–15% increases.
Forrester research shows CMOs switching from last-click to Markov models reallocate 12–20% of budget to previously undervalued channels. Post-reallocation aggregate ROAS improves 15–28% within 2 quarters as accurate attribution informs smarter spending.
Mid-Funnel Discovery
Bridge Touchpoint Identification: Markov models reveal specific channel sequences that act as conversion accelerators. Example: Users who progress Paid Search → Content Download → Webinar convert at 4.3%, while Paid Search → Webinar (skipping content) converts at 1.9%.
This sequential dependency insight is invisible to position-based or linear models. HubSpot Research data shows B2B marketers using Markov attribution increase content marketing budgets by 18–25% after discovering content’s role as a critical bridge touchpoint.
Budget Optimization Benchmarks
Metric: Channel-Level ROAS Accuracy. Organizations using Markov models report 85–92% alignment between attributed channel ROAS and incrementality test results, vs. 65–72% alignment for linear models and 58–68% for last-click.
CAC Reduction: By identifying and amplifying high-removal-effect channels, CMOs reduce blended CAC by 12–22%. Mechanism: Stop overinvesting in low-removal-effect channels (those that appear in journeys but don’t move conversion probability) and shift budget to high-impact sequences.
Limitations and Deployment Considerations
Markov chain models deliver superior sequential insights but require specific data conditions and careful interpretation to avoid misattribution.
Data Volume Sensitivity
Sparse Data Problem: Rare channel sequences produce unstable transition probabilities. If only 5 users ever progressed Podcast → Display → Conversion, the calculated P(Podcast→Display) is unreliable—high variance, low confidence.
Threshold Requirements: Each unique transition should appear in 50+ journeys for stable probability estimation. Channels with <2% journey appearance rate should be grouped into "Other" category. Total dataset should contain 2,000+ conversion journeys and 5,000+ total journeys (including null conversions) for enterprise-grade stability.
New Channel Cold Start
Problem: Newly launched channels have zero historical journey data. Markov model cannot calculate removal effect without observed transitions.
Solution: Run parallel attribution during 4–8 week learning period. Use rule-based attribution (linear or time decay) for new channels. Once new channel appears in 200+ journeys, integrate into Markov transition matrix. Validate removal effect against holdout incrementality test before relying on Markov credit allocation.
Over-Attribution Risk
Multi-Path Inflation: If a user converts through Path A (Social→Email→Search→Conversion) but also simultaneously engaged Path B (Display→Content→null), Markov may attribute conversion to all touchpoints across both paths even though Path B didn’t complete.
Mitigation: Use conversion-only paths for primary model (exclude null paths from transition matrix). Implement session-based journey segmentation—only attribute within sessions that end in conversion. Cap maximum path length at 20 touchpoints to prevent noise accumulation.
When NOT to Use Markov Attribution
Low Journey Complexity: Single-touch or two-touch customer journeys (e.g., simple lead gen with one ad click and form submission). Markov adds computational overhead without insight—use first-touch or last-click instead.
Insufficient Data Volume: <500 total conversion journeys per month. Transition probabilities will be too unstable for reliable removal effect calculation. Use aggregated rule-based models until data volume scales.
Real-Time Attribution Needs: Markov requires batch processing to rebuild transition matrices. For real-time bidding optimization or immediate campaign adjustments, use simpler algorithmic models (position-based or time decay) that update instantly with new data.
Technology Stack Requirements
Markov attribution demands data engineering capabilities, statistical computing environments, and integration architecture for production deployment.
Core Components
Data Warehouse & Journey Storage: Cloud platforms: Snowflake, BigQuery, Databricks, Redshift. Journey schema: User-level event logs with touchpoint sequences, timestamps, channel metadata. Query performance: Sub-minute response for 10M+ journey records (required for monthly model rebuilds).
Statistical Computing: Python libraries: markov-attribution (open-source), pandas (data manipulation), numpy (matrix operations), scipy (probability calculations). R packages: ChannelAttribution, markovchain, dplyr. Execution environment: Jupyter notebooks for exploration, production-grade data pipelines for scheduled model runs.
Visualization & BI Integration: Tableau, Looker, Power BI for attribution reporting. Custom dashboards showing: Channel attribution percentages, Removal effect rankings, Transition probability heatmaps, Journey path frequency distributions.
Attribution Platforms with Markov Support
Enterprise Solutions: Google Analytics 4 data-driven attribution (proprietary Markov variant). Adobe Analytics with Markov module (requires Data Workbench). Neustar MarketShare (Markov + MMM hybrid). CaliberMind (chain-based attribution for B2B).
Mid-Market & Startup Tools: HockeyStack (custom Markov model builder). Dreamdata (Markov option in attribution settings). SegmentStream (predictive vs. data-driven comparison). OWOX BI (Markov implementation via SQL pipelines).
Build vs. Buy Decision: Build in-house if: You have 10,000+ monthly conversions, data engineering team with Python/R expertise, custom channel taxonomy needs. Buy platform if: <5,000 monthly conversions, limited technical resources, need plug-and-play CRM integration.
Frequently Asked Questions
How does Markov Chain Attribution differ from Shapley Value attribution?
Both are data-driven algorithmic models but use different mathematical foundations.
Markov evaluates removal effect—how much conversion probability drops when a channel is removed from the journey graph. Shapley calculates marginal contribution—the average value a channel adds across all possible journey orderings (factorial complexity).
Key difference: Markov captures sequential dependencies (Channel A→B→C may produce different results than A→C→B). Shapley is order-agnostic—it averages contribution across all orderings, losing sequence-specific insights.
Computational cost: Markov scales linearly with journey count. Shapley scales factorially with touchpoint count (10 touchpoints = 3.6M permutations to evaluate). For high-volume B2B journeys with 10–15 touchpoints, Markov is significantly more practical.
What data volume is required for reliable Markov attribution?
Minimum thresholds depend on channel count and journey complexity.
Base requirement: 500–1,000 completed conversion journeys for initial model stability. 2,000+ journeys for confidence in channel-specific removal effects. Per-channel requirement: Each unique channel should appear in 100+ journeys. Each channel-to-channel transition should occur 50+ times.
Journey complexity multiplier: For 5–8 channels, 1,000 journeys sufficient. For 10–15 channels, need 2,500–5,000 journeys. For 15+ channels, require 5,000+ journeys or implement channel grouping to consolidate low-volume channels.
Validation metric: Calculate coefficient of variation for channel attribution values across 10 model runs with random 80% data samples. If CV >15%, data volume is insufficient—increase dataset or group channels.
Can Markov attribution handle offline touchpoints?
Yes, but requires robust identity resolution to stitch offline events into digital journey sequences.
Implementation approach: Assign offline touchpoint IDs (trade show attendance, sales call, direct mail response) to user records using: Deterministic matching (email capture at event, phone number from call logs), Probabilistic matching (IP + timestamp + geographic clustering), CRM-based stitching (offline event appended to contact record, synced to digital tracking).
Once offline events are incorporated into journey sequences with timestamps, Markov treats them identically to digital touchpoints—calculating transition probabilities and removal effects across the full omnichannel journey.
Challenge: Offline event volumes are typically 10–100x lower than digital touchpoints. This creates sparse transition data for offline channels. Solution: Aggregate offline touchpoints by type (all events as “Events,” all calls as “Sales Calls”) rather than individual instances to achieve sufficient transition frequency.
How often should I rebuild the Markov attribution model?
Rebuild frequency depends on campaign velocity and channel mix stability.
High-velocity environments (B2C, e-commerce, performance marketing): Monthly rebuilds. Channel mix and creative rotations change rapidly—transition probabilities shift month-over-month. Quarterly rebuilds insufficient to capture campaign-level performance changes.
Stable environments (B2B enterprise, long sales cycles, consistent channel mix): Quarterly rebuilds. Channel strategies evolve slowly; transition probabilities remain relatively stable. Monthly rebuilds add computational cost without meaningful attribution changes.
Trigger-based rebuilds regardless of schedule: New channel launch (requires 4–8 weeks of data before integration), Channel removal (rebuild immediately to redistribute attribution), Conversion rate change >30% (indicates fundamental journey shift), Major campaign launches (big budget shifts alter transition dynamics).
Validation: Compare month-over-month channel attribution shifts. If changes are <5% across all channels, rebuild frequency can be reduced. If changes are >20%, increase rebuild frequency or investigate data quality issues.
Does Markov attribution work for B2B multi-stakeholder journeys?
Yes, but requires account-level journey aggregation rather than individual contact tracking.
B2B implementation approach: Group all touchpoints by account (company domain) instead of individual contact. Journey sequence includes all interactions across all buying committee members—CMO attends webinar, demand gen manager downloads whitepaper, VP evaluates demo. Treat account progression as single journey with multiple parallel touchpoints.
Technical modification: Allow simultaneous states in transition matrix (Account in State: Webinar + Content Download rather than strictly sequential State A→State B). Calculate removal effect at account level—if we removed webinars, how many accounts would fail to convert?
Best practice: Use account-based attribution platforms (CaliberMind, Dreamdata, 6sense) that natively handle multi-stakeholder journey aggregation. Building custom Markov models for ABM requires significant data engineering to properly stitch account-level sequences.
What’s the computational cost of running Markov attribution?
Computational complexity scales with journey count × channel count × unique path diversity.
Benchmark processing times: 1,000 journeys, 8 channels: 2–5 minutes on standard compute. 10,000 journeys, 12 channels: 15–30 minutes. 100,000 journeys, 15 channels: 2–4 hours. 1M+ journeys, 20 channels: 8–12 hours (requires distributed processing).
Cost factors: Transition matrix construction: O(n × m) where n = journey count, m = unique channel pairs. Path enumeration: O(n × p) where p = average path length. Removal effect calculation: O(c × p) where c = channel count (must rebuild matrix c times, once per channel removal).
Optimization strategies: Use sampling for large datasets (random 20,000-journey sample for model development, full dataset for production runs), Implement parallel processing for removal effect calculations (each channel removal runs independently), Cache transition matrices between runs (only rebuild when underlying data changes), Use GPU-accelerated matrix operations for 100K+ journey datasets.
How do I validate that my Markov model is producing accurate attributions?
Validation requires comparing Markov outputs against ground-truth incrementality tests and business logic sanity checks.
Primary validation: Incrementality testing. Run holdout experiments for 2–3 key channels. Suppress channel for control group, measure conversion rate difference. Compare incrementality lift to Markov attributed lift. Acceptable alignment: within 15–25% of each other.
Secondary validation: Attribution sum reconciliation. Sum all channel attributed conversions. Must equal total actual conversions (within 1–2% due to rounding). If sum is significantly higher/lower, model is over/under crediting—indicates transition probability calibration issues.
Tertiary validation: Business logic checks. Branded search should have high removal effect (users actively seeking brand convert at high rates). Generic awareness channels (display, social) should have moderate removal effects. Last-touch retargeting should have lower removal effects than mid-funnel nurture (retargeting often captures already-converted intent).
Cross-model comparison: Run parallel attribution using Markov, Shapley, and position-based models. Channels with consistent high attribution across all three models are reliably high-performers. Channels with high variance across models require additional investigation (may indicate data quality issues or unique sequential dependencies).