Watch lead source tracking in action
You are generating leads from Facebook Campaign Manager and sending them to Pipedrive, but you don’t know which exact campaign, ad set, or ad generated each lead.
Facebook only provides the aggregated number of leads generated from a campaign. Once a lead turns into a paid customer, however, you can’t connect that revenue to the specific Facebook campaign, ad set, or ad.
In this article, I will show you a method to capture Facebook ad parameters in Pipedrive for each lead.
LeadSources is a marketing attribution software that tracks Facebook ad parameters for each lead you generate.
When a visitor converts into a lead, LeadSources injects the Facebook ad parameters contained in the URL into Pipedrive.
Every lead comes with a rich lead source report including:
LeadSources automatic attribution works for Facebook, as well as other channels: PPC, SEO, social, PR, emailing, etc.
LeadSources relies on a robust attribution algorithm to ensure attribution for 100% of the leads:
Now, imagine a user visits your site from a Facebook ad, and leaves without filling out your form.
Four months later, that same user returns to your site from an organic search, and fills out your form.
LeadSources remembers all previous visits and provides a complete lead source report containing comprehensive lead source data for every session that occurred (from first click to form submission).
Tracking the full lead journey helps you understand the role each marketing channel plays in your lead generation strategy.
You can then calculate the exact ROI for each channel that contributed to the sale.
Sign up to LeadSources (we offer a 14-day free trial).
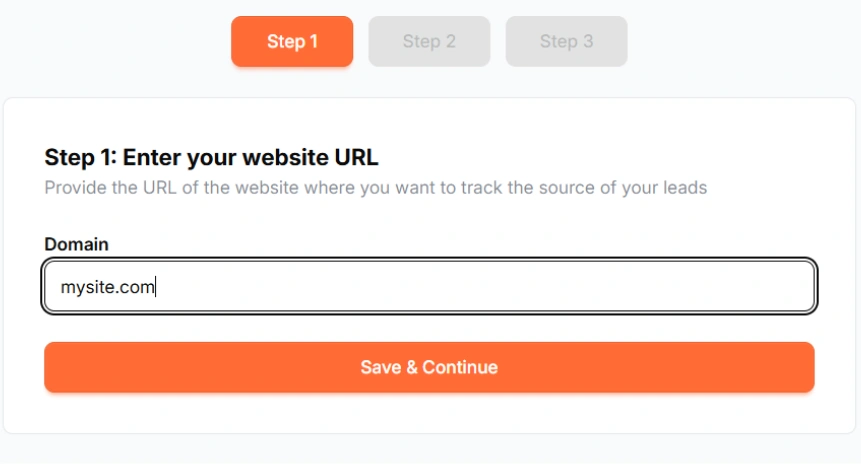
Enter the URL of the website you want to track.

Copy and paste your LeadSources tracking code into the <head> section of your website.
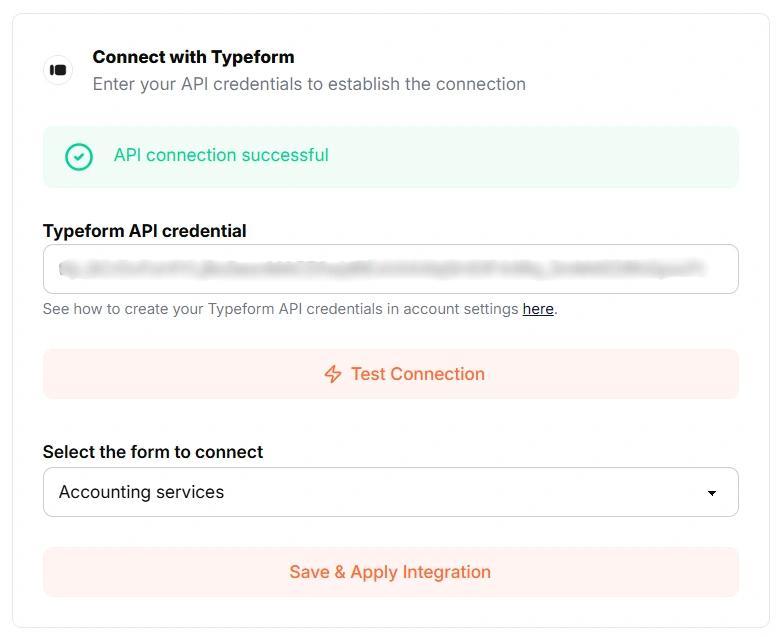
Connect your form in one click with our native integrations.
Select the form you want to track.
LeadSources will start tracking the Facebook ad parameters for every lead you generate.

You can send to Pipedrive the following Facebook ad parameters for each lead:

Yes. You can send Facebook ad parameters to Pipedrive using LeadSources:
LeadSources collects the following Facebook ad parameters for each lead you generate (Make sure to add them to the URLs of your different marketing campaigns):
Besides the UTM parameters, the following lead source data is also appended to each lead:
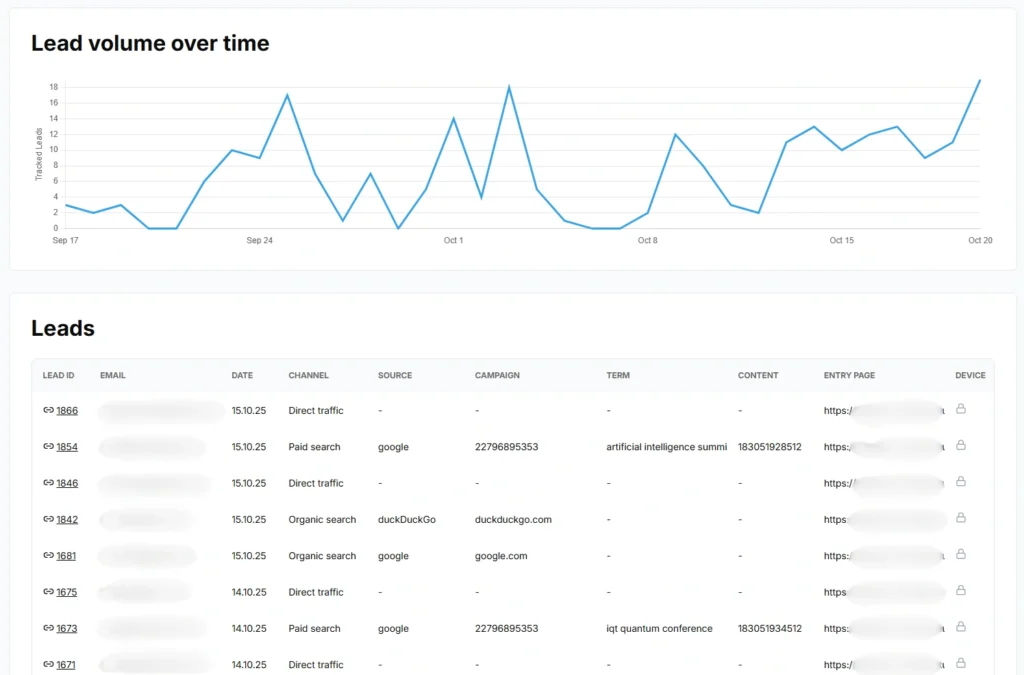
This data is available in your LeadSources dashboard.
You can send the following last-touch attribution data to Pipedrive:
As multi-touch attribution software, LeadSources tracks Facebook ad parameters throughout the entire customer journey (from first click to lead submission). This data is displayed on your LeadSources dashboard.
From there, you can send the last-touch attribution data (including Facebook ad parameters) in Pipedrive.
Start your free trial today and track the full source of every lead throughout their journey.