While Google Analytics provides traffic insights, it doesn’t let you trace every lead back to its exact source.
Likewise, if a lead becomes a customer, you’re unable to identify the precise channel or ad responsible.
Why? Because Google Analytics reports lead origins at an aggregated level (e.g., 50 leads came from the Paid Search channel).
However, we have the ability to identify the exact source for every single lead.
So when this lead transitions into a paid customer, we can link it to the channel responsible for generating it.
Fortunately, there is a convenient way to link each lead to the corresponding channel that generated it, and transmit this data into Pipedrive, allowing for precise tracking of the channel that brought in each paid customer.
Let’s take it step by step!
How to track Google Analytics data in Pipedrive
Step 1: Add Leadsources in your website

Leadsources is a user-friendly tool designed to track lead source data, much like Google Analytics. Upon installation, it tracks up to 7 data points for each lead you create:
- Channel
- Source
- Campaign
- Term
- Content
- Landing page
- Landing page subfolder
➡️ Sign up to Leadsources.io for free
➡️ Add the Leadsources tracking code to your site
Step 2: Add the hidden fields in your form

Hidden fields are not visible to the user but can carry data that gets sent along with the form submission.
Leadsources places lead source data in hidden fields. When a visitor submits the form, the lead source is automatically populated in these fields.
Step 3: Send lead source data to Pipedrive

The lead source data is transferable from your form builder to Pipedrive.
The source of your leads, sales, and revenue can be tracked directly within Pipedrive.
This bridges the gap between your marketing campaigns and sales results.
How does Leadsources work?
As soon as a visitor arrives on your website, Leadsources captures lead source data and populates it into the hidden fields of your form, similar to Google Analytics. After form submission, this data, including the lead’s name and email, is transferred to Pipedrive.
Leadsources records the lead source data for each generated lead:
| Lead source data | Fetched automatically |
| Channel | ✅ |
| Source | ✅ |
| Campaign | ✅ OR use UTM_campaign |
| Content | UTM_content parameter is required |
| Term | UTM_term parameter is required |
| Landing page | ✅ |
| Landing page subfolder | ✅ |
Even when UTM parameters aren’t applicable—such as with organic sources like Google search or when your site is mentioned in an article—Leadsources captures the following lead source data:
✅Channel
✅Source
✅Campaign
✅Landing page
✅Landing page subfolder
Leadsources is unique, as it tracks lead sources across both organic and paid marketing channels.
Performance reports: Lead, sales, and revenue by source
Tracking lead source data in Pipedrive enables the generation of performance reports, including:
- Leads, sales, and revenue by channel
- Leads, sales, and revenue by source
- Leads, sales, and revenue by campaign
- Leads, sales, and revenue by term (e.g. keyword or adset)
- Leads, sales, and revenue by content (e.g. ad)
- Leads, sales, and revenue by landing page
- Leads, sales, and revenue by landing page subfolder
With this, you can adjust your marketing spend according to the channels, sources, campaigns, terms, and content that yield the highest leads, sales, and revenue.
Next, let’s examine the reports you are able to generate.
1. Lead source reports
Produce performance reports illustrating the number of leads generated by:
- Channel
- Source
- Campaign
- Term (e.g. keyword or adset)
- Content (e.g. ad)
- Landing page
- Landing page subfolder
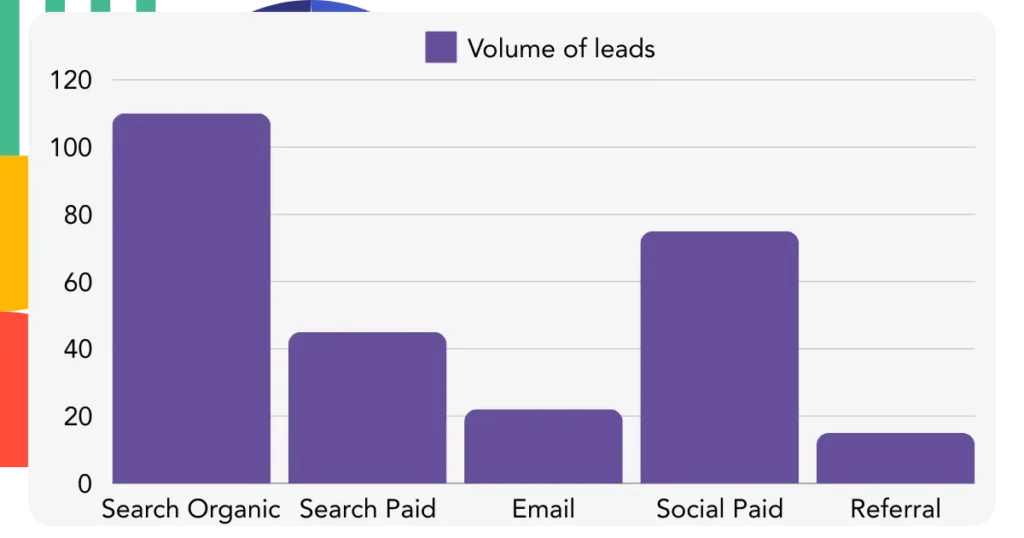
Example #1: Leads by channel
With this report, you can determine which channel is responsible for generating the most leads.

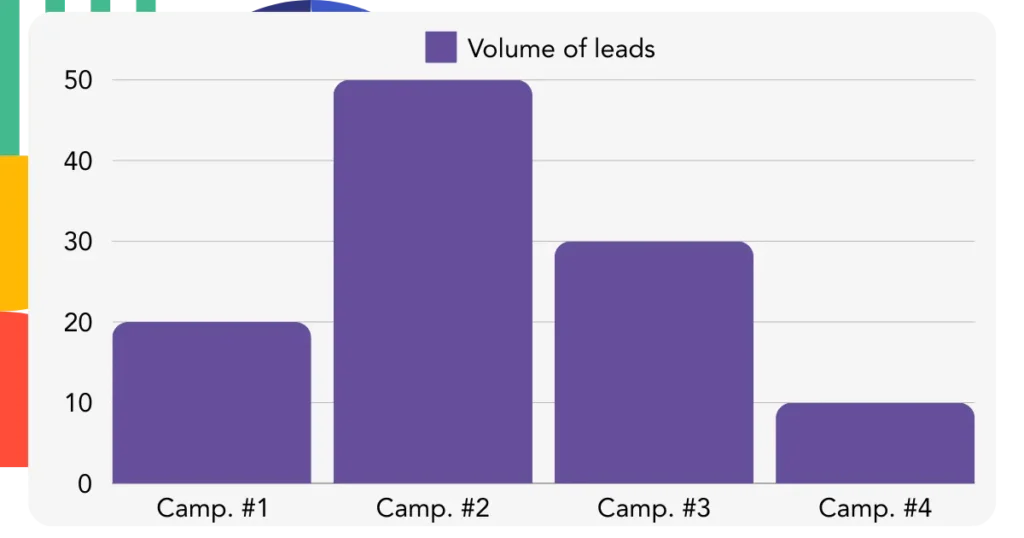
Example #2: Leads by campaign
You can now target a specific lead source (e.g., Google Ads) and assess the number of leads generated by each campaign.

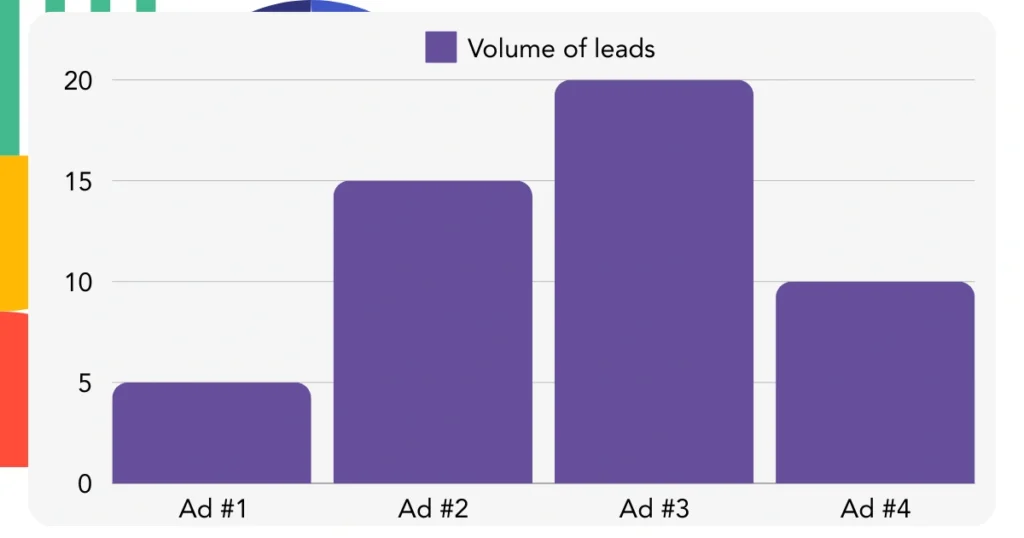
Example #3: Leads by keyword and ad
After identifying the campaign with the highest lead generation, you can assess which particular keyword ad is bringing in those leads.

2. Sales and revenue source reports
After determining which channels, sources, campaigns, terms, and content are driving leads, we must now verify if these leads are translating into sales and revenue.
To accomplish this, direct your leads to Pipedrive, which allows you to keep track of sales and revenue across channels, sources, campaigns, keywords, content, landing pages, and subfolders.
By using this information, you can enhance your marketing strategy to concentrate on the channels and campaigns that yield the greatest sales and revenue.
You have the ability to create in-depth sales and revenue reports, such as:
- Sales and revenue by channel
- Sales and revenue by source
- Sales and revenue by campaign
- Sales and revenue by term (e.g. Keywords)
- Sales and revenue by content (e.g. Ads)
- Sales and revenue by landing page
- Sales and revenue by landing page subfolder
To provide an example, let’s examine the following scenario:
| Channels | Search Paid | Social Paid |
|---|---|---|
| Leads | 50 | 75 |
| Sales | 5 | 6 |
| Avg. Order Value | $150 | $100 |
| Revenue | $750 | $600 |
The initial “Leads by Channel” report, after launching ads on Google Ads and Facebook Ads Manager, indicated that Facebook (Social Paid) brought in more leads than Google (Search Paid).
When you examined the sales and revenue data in Pipedrive, it became clear that Search Paid produced greater revenue with fewer leads than Social Paid. As a result, you redirected your budget to focus on Search Paid.
LeadSources tracks the source of each lead in Pipedrive, whether they come from ads, organic search, social, email, etc. and syncs that data with each submission. See the full breakdown on the lead source in Pipedrive page.

