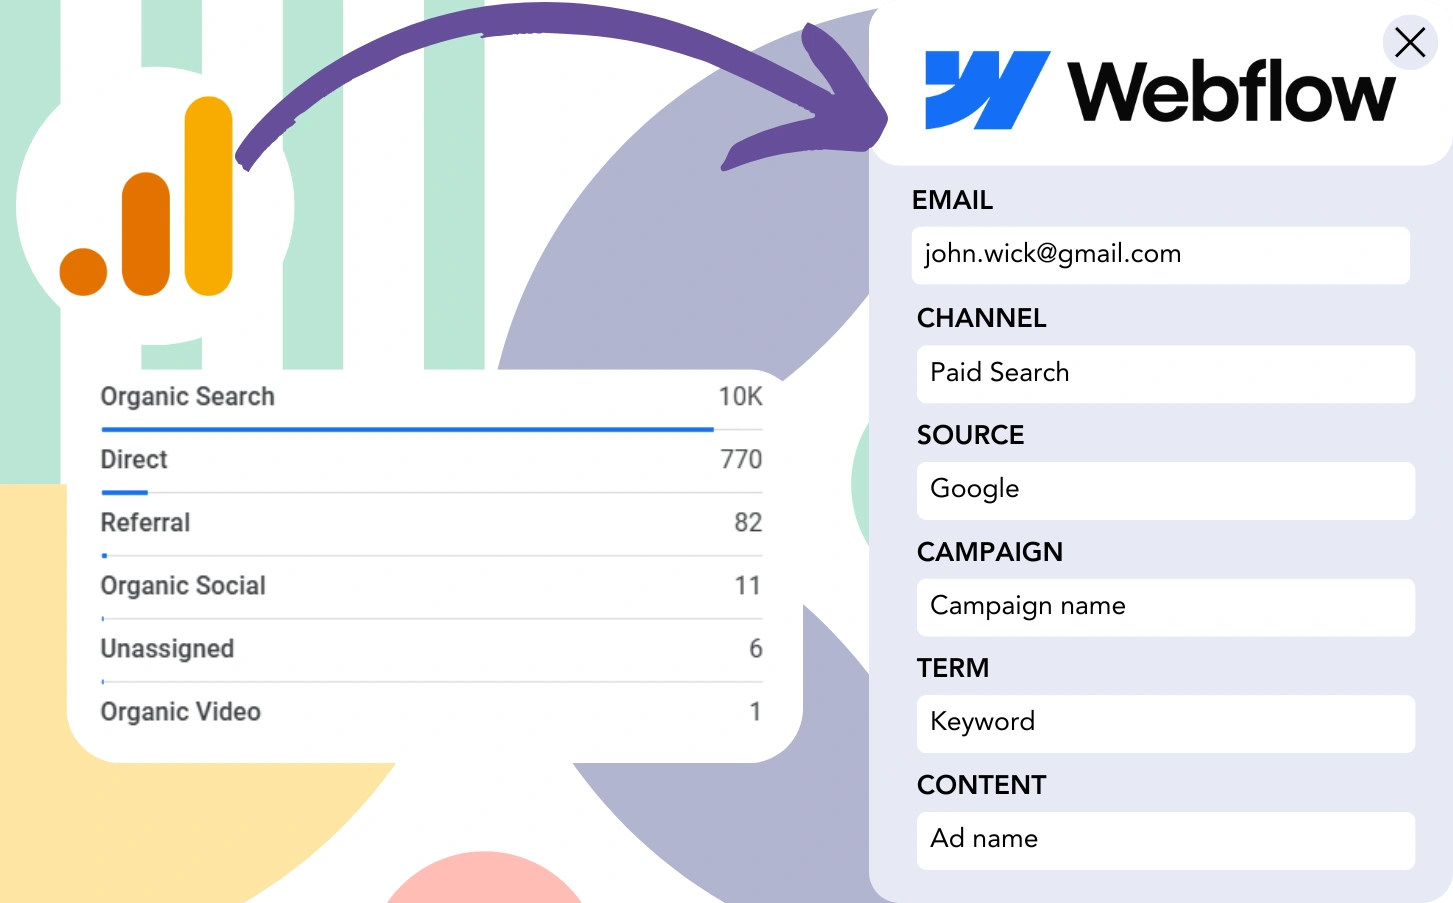
While Google Analytics helps you track lead sources, it doesn’t allow to identify individual leads to their originating channels.
Likewise, when a lead converts into a customer, it’s difficult to trace that customer to a specific channel or advertisement.
Why? Because Google Analytics aggregates lead source data, showing only summary details (e.g., “50 leads from Paid Search”) rather than individual lead specifics.
❌ As a result, you can’t identify which channels are generating leads and customers. And you end up spending on multiple channels without clarity on their effectiveness.
✅ What we aim for instead is to track leads at the individual level. So when a specific lead converts into a paying customer, we can identify the channel that brought it in.
Fortunately, there’s a simple method to connect each lead and customer to the channel that produced it.
Let’s walk through the process step by step!
How to track Google Analytics data in Webflow
Step 1: Add Leadsources in your website

Leadsources is an easy-to-use tool that tracks up to 7 lead source data points, just like Google Analytics. Once installed on your website, it tracks 7 distinct lead source data for every lead you generate:
- Channel
- Source
- Campaign
- Term
- Content
- Landing page
- Landing page subfolder
➡️ Sign up to Leadsources.io for free
➡️ Add the Leadsources tracking code to your site
Step 2: Add the hidden fields in Webflow
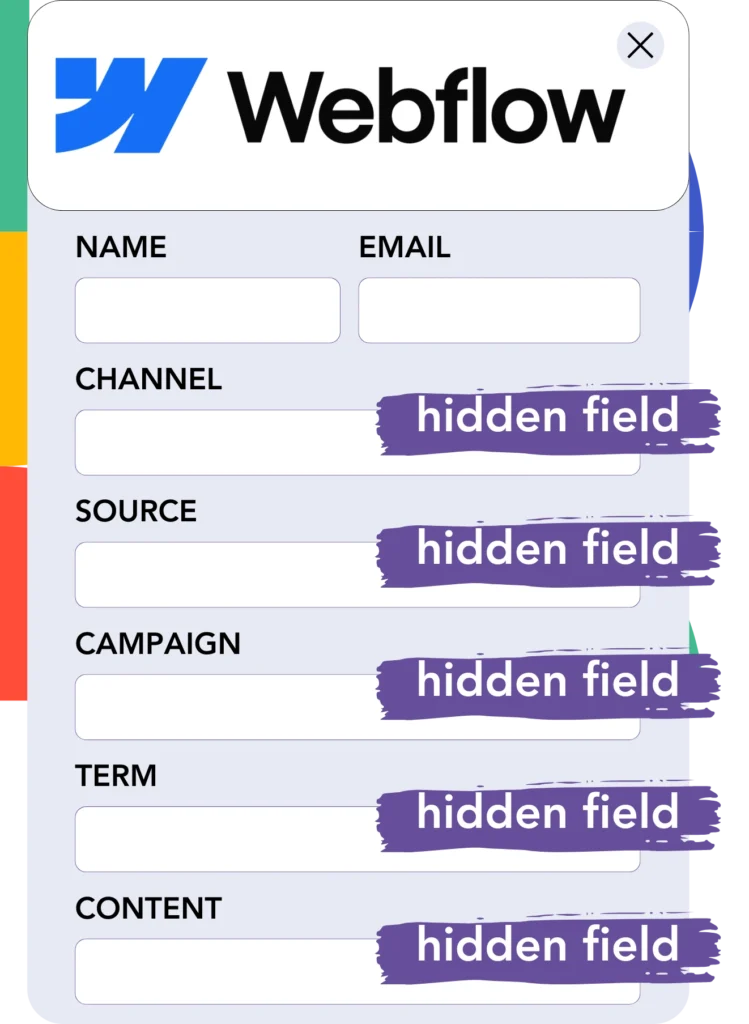
Hidden fields are form fields that remain invisible but store data submitted with the form.
When a user submits your Webflow, Leadsources automatically populates the hidden fields with lead source data, which is then saved in your Webflow upon submission.
Step 3: Capture lead source data in Webflow
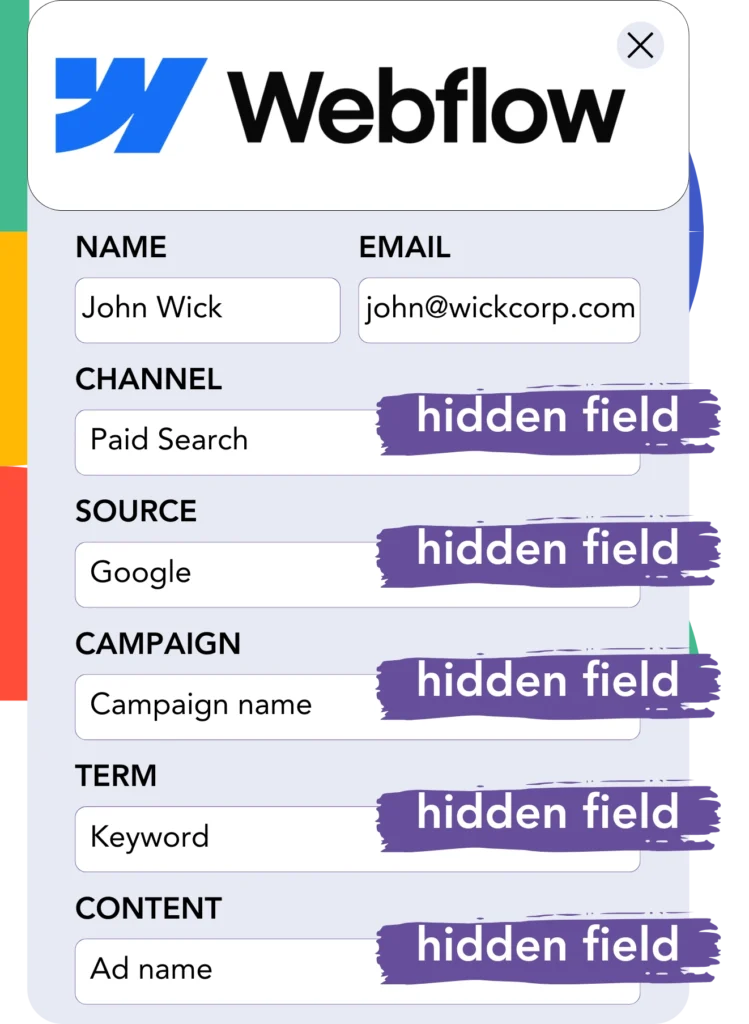
When visitors land on your site, Leadsources collects the lead source data (such as channel, source, etc.).
This data is subsequently inserted into the hidden fields of Webflow.
After the form is submitted, the lead source data will be displayed alongside the lead details directly in Webflow.
How does Leadsources work?
When a user visits your site, Leadsources collects the lead source data and fills the hidden fields of your form. After submission, this data, along with lead details such as name and email, is sent to Webflow.
Leadsources captures the lead source information for every lead:
| Lead source data | Fetched automatically |
| Channel | ✅ |
| Source | ✅ |
| Campaign | ✅ OR use UTM_campaign |
| Content | UTM_content parameter is required |
| Term | UTM_term parameter is required |
| Landing page | ✅ |
| Landing page subfolder | ✅ |
When UTM parameters are not present, such as with organic Google search results or mentions in articles, Leadsources continues to capture the following lead source data:
✅Channel
✅Source
✅Campaign
✅Landing page
✅Landing page subfolder
Unlike other tools, Leadsources monitors lead sources across both organic and paid marketing channels.
Performance reports: Lead, sales, and revenue by source
By capturing the lead source data in Webflow, you can create performance reports such as:
- Leads, sales, and revenue by channel
- Leads, sales, and revenue by source
- Leads, sales, and revenue by campaign
- Leads, sales, and revenue by term (e.g. keyword or adset)
- Leads, sales, and revenue by content (e.g. ad)
- Leads, sales, and revenue by landing page
- Leads, sales, and revenue by landing page subfolder
This enables you to modify your marketing budget according to the channels, sources, campaigns, keywords, content, and other factors that drive the most leads, sales, and revenue.
Let’s take a look at some of the reports you can generate.
1. Lead source reports
Create performance reports that display the volume of leads generated by:
- Channel
- Source
- Campaign
- Term (e.g. keyword or adset)
- Content (e.g. ad)
- Landing page
- Landing page subfolder
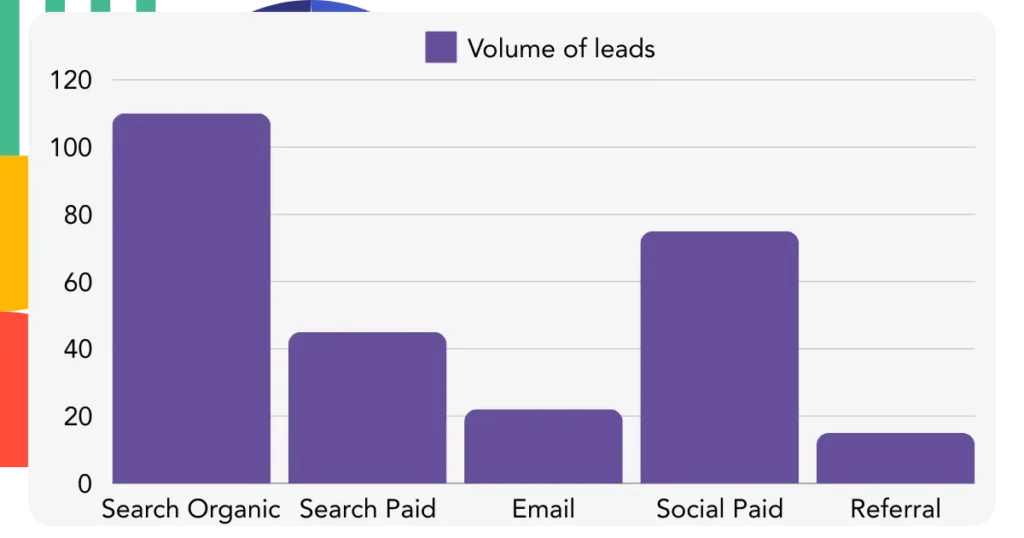
Example #1: Leads by channel
This report reveals the channel that generates the highest number of leads.
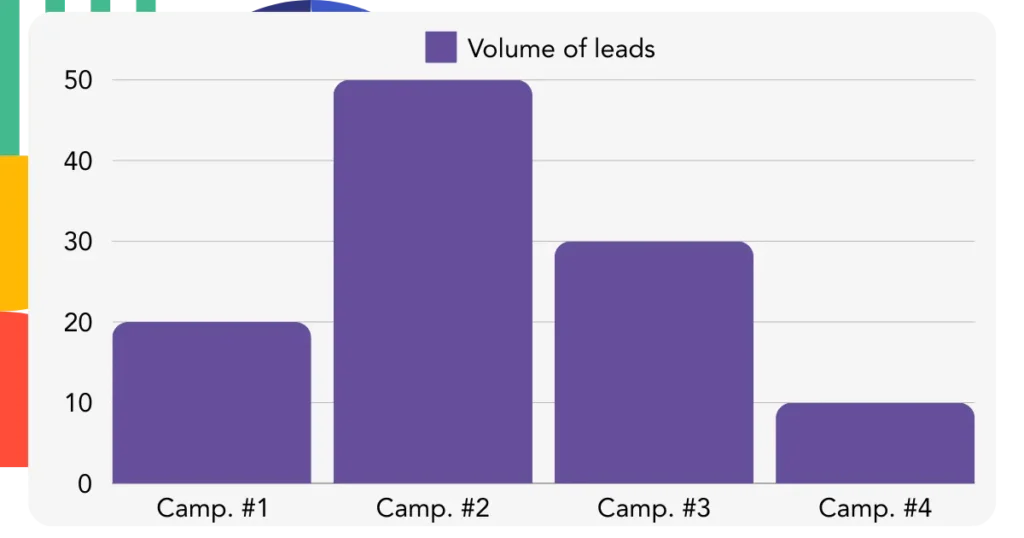
Example #2: Leads by campaign
You can now focus on a particular channel (e.g., Paid Search) and monitor the lead volume generated by each campaign.
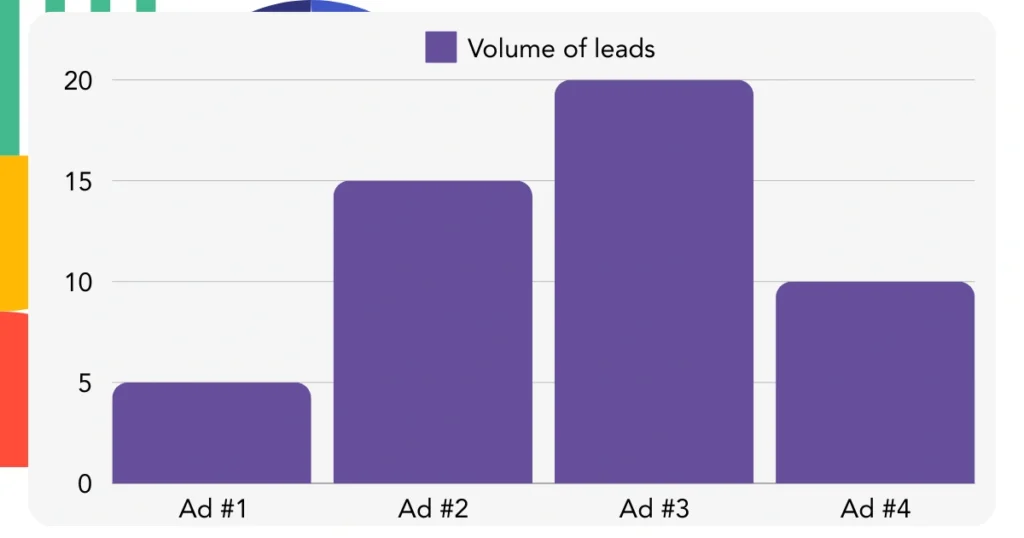
Example #3: Leads by keyword and ad
Once you determine which Paid Search campaign produces the most leads, you can examine the specific keyword or ad responsible for driving those leads.
2. Sales and revenue source reports
Now that we’ve identified the channel, source, campaign, term, and content driving leads, it’s time to assess if these leads are converting into sales and revenue.
To accomplish this, integrate Webflow with a CRM to monitor sales and revenue across various channels, sources, campaigns, terms, content, landing pages, and their subfolders.
With this data, you can optimize your marketing strategy to prioritize the channels, sources, campaigns, terms, and content that drive the highest sales and revenue.
You can also generate different sales and revenue reports, including:
- Sales and revenue by channel
- Sales and revenue by source
- Sales and revenue by campaign
- Sales and revenue by term (e.g. Keywords)
- Sales and revenue by content (e.g. Ads)
- Sales and revenue by landing page
- Sales and revenue by landing page subfolder
To illustrate, let’s consider the following scenario:
| Channels | Search Paid | Social Paid |
|---|---|---|
| Leads | 50 | 75 |
| Sales | 5 | 6 |
| Avg. Order Value | $150 | $100 |
| Revenue | $750 | $600 |
After launching campaigns on Google Ads and Facebook Ads Manager, the initial “Leads by Channel” report indicated that Facebook (Social Paid) generated more leads than Google (Search Paid).
However, upon analyzing sales and revenue data in your CRM, you discovered that Search Paid generated higher revenue with fewer leads than Social Paid. As a result, you decided to allocate more of your budget to Search Paid.
LeadSources tracks the source of each lead on Webflow, whether they come from ads, organic search, social, email, etc. and syncs that data with each submission. See the full breakdown on the lead source in Webflow page.

