
TL;DR:
- Machine Learning Attribution leverages neural networks and algorithmic models to dynamically assign credit across touchpoints, delivering 15–28% more accurate ROI measurement than rule-based methods.
- Unlike static models, ML attribution continuously learns from behavioral patterns, adapting credit allocation in real time as customer journeys evolve across 8+ channels.
- CMOs report 18–32% higher marketing efficiency gains when combining ML attribution with unified identity data and automated budget reallocation workflows.
What Is Machine Learning Attribution?
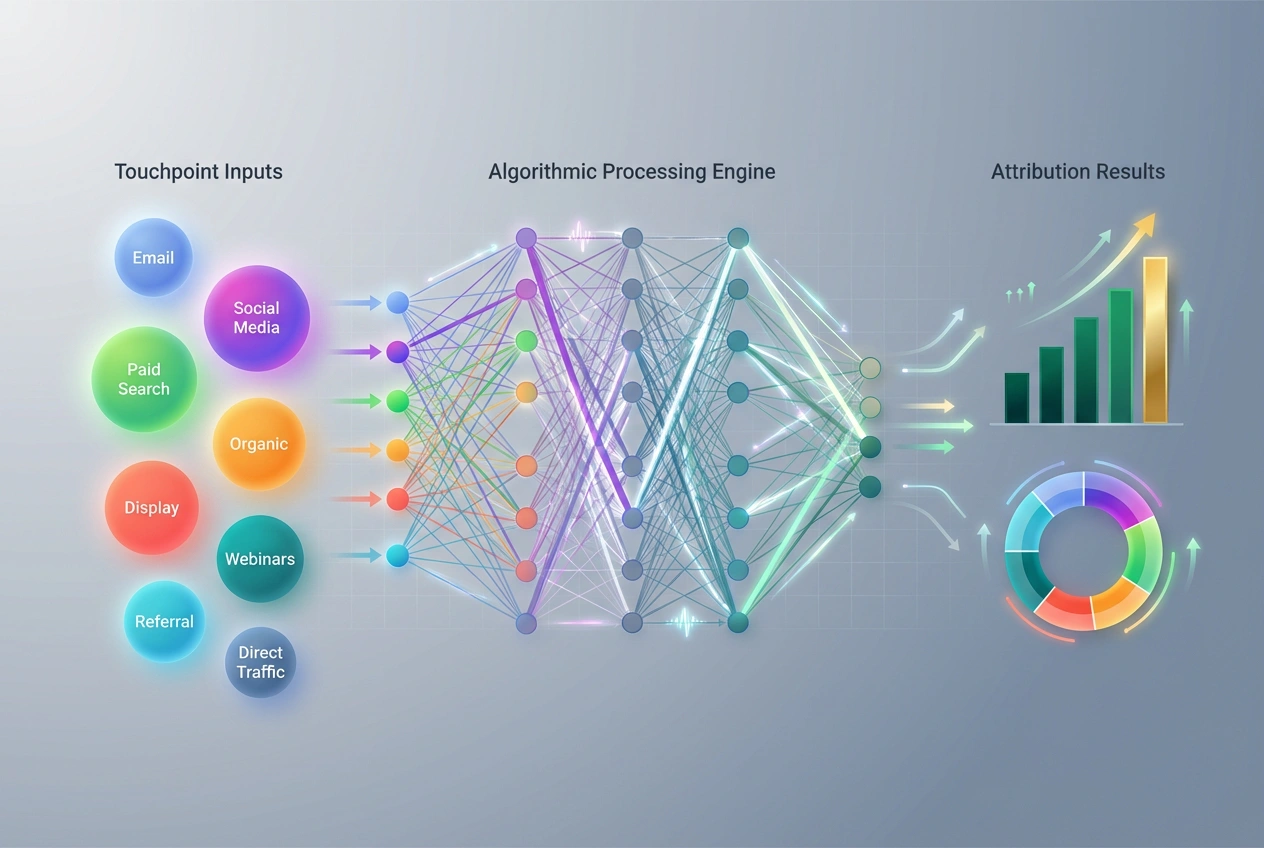
Machine Learning Attribution is an algorithmic attribution methodology that applies supervised learning, neural networks, and probabilistic modeling to quantify each marketing touchpoint’s incremental contribution to conversions. Rather than assigning credit via predefined rules (first-touch, last-touch, linear), ML models ingest historical interaction data—ad impressions, email opens, content downloads, social engagements—and calculate dynamic credit weights based on empirical conversion patterns.
The core mechanism: supervised learning algorithms train on labeled conversion data (converted vs. non-converted paths) to identify feature importance across touchpoints. Ensemble methods like gradient boosting or deep learning architectures extract non-linear relationships that rule-based models miss. For example, a B2B SaaS journey might reveal that webinar attendance + LinkedIn ad impression within 72 hours yields 4.2× higher conversion probability than either touchpoint alone—a synergy only ML can detect at scale.
Technical architecture typically includes: (1) data ingestion layer aggregating CRM, ad platforms, web analytics, and offline touchpoints into unified customer profiles; (2) feature engineering to create interaction sequences, time-decay variables, and cross-channel indicators; (3) model training using logistic regression, random forests, or neural networks; (4) credit allocation via Shapley values, removal effect, or marginal contribution scoring; (5) validation through holdout testing and incrementality experiments.
Industry benchmarks: Gartner research indicates that organizations implementing custom algorithmic attribution report 15–25% more accurate ROI measurement compared to position-based models. HubSpot State of Marketing 2026 data shows 62% of high-growth companies (>25% YoY revenue increase) use ML-driven attribution vs. 31% of flat-growth peers.
Test LeadSources today. Enter your email below and receive a lead source report showing all the lead source data we track—exactly what you’d see for every lead tracked in your LeadSources account.
Why Machine Learning Attribution Matters for Lead Attribution
Lead attribution platforms like LeadSources.io generate granular interaction data—9 data points per lead across sessions, referrers, UTM parameters, landing pages. ML models transform this raw telemetry into strategic intelligence by answering: “Which lead source combinations drive highest LTV:CAC ratio?” Traditional last-touch attribution would credit only the final form fill, ignoring the nurture sequence that qualified the lead.
Quantifying True Lead Source Value
ML attribution applies counterfactual analysis: calculating conversion probability with and without specific lead sources. Formula: Attribution Value = P(Conversion|Touchpoint Present) – P(Conversion|Touchpoint Absent). For a demo request lead, ML might reveal: organic blog post (32% incremental lift) + retargeting ad (18% lift) + email nurture (41% lift) = 91% combined effect, whereas last-touch would assign 100% credit to email alone.
B2B case study: a marketing automation vendor integrated ML attribution with LeadSources.io tracking. Discovery: leads sourced from industry webinars + followed up within 4 hours converted at $47K ACV vs. $28K for other sources. ML identified the interaction effect (webinar credibility × rapid response), enabling a targeted playbook. Result: 23% increase in pipeline value, 17% reduction in CAC over two quarters.
Adaptive Credit Across Multi-Session Journeys
Enterprise buying cycles span 3.7 months on average (Forrester B2B Buyer Journey Survey 2025), involving 6.8 decision-makers and 12+ touchpoints. ML models handle temporal dynamics through recurrent neural networks (RNNs) or time-decay gradient boosting, assigning higher weights to touchpoints closer to conversion while preserving early-stage awareness credit.
Unlike static time-decay (arbitrary 7-day half-life), ML learns optimal decay rates from data. Example output: for enterprise deals >$100K, content engagement 60–90 days pre-conversion receives 22% credit vs. 8% for SMB deals (shorter consideration). This granularity enables segment-specific CAC optimization.
How Machine Learning Attribution Works
ML attribution operates through a four-stage pipeline: data preparation, feature engineering, model training, and credit allocation.
Stage 1: Unified Data Foundation
Integrate cross-channel interaction data into a centralized data warehouse (Snowflake, BigQuery, Redshift). Required inputs: CRM lead/opportunity records, marketing automation activity logs (email, landing page, form fills), ad platform impressions/clicks (Google, Meta, LinkedIn), web analytics sessions (GA4, Segment), and offline touchpoints (events, direct mail, phone calls).
Data quality requirements: ≥95% identity resolution accuracy (matching anonymous sessions to known contacts), <2% duplicate records, complete timestamp precision (millisecond-level), and standardized UTM taxonomy. Poor data quality degrades model accuracy exponentially—10% noisy training data can reduce precision by 30%.
Stage 2: Feature Engineering
Transform raw interactions into model inputs. Key feature categories: (1) Touchpoint attributes—channel, campaign, content type, creative format, device; (2) Sequence features—position in journey (1st, 2nd, nth), time since previous touch, path length; (3) Temporal features—day of week, time of day, days to conversion; (4) Firmographic/demographic—industry, company size, role, geography; (5) Engagement depth—session duration, pages viewed, video completion rate.
Advanced techniques: create interaction terms (e.g., “LinkedIn ad × content download within 48h”), apply embeddings for high-cardinality categorical variables (campaign names), and generate lagged features capturing momentum (3-day moving average of engagement).
Stage 3: Model Training
Split historical data into training (70%), validation (15%), and holdout test (15%) sets. Popular algorithms: (1) Gradient Boosted Trees (XGBoost, LightGBM)—handle non-linearity, missing data, and feature interactions; achieve 0.82–0.88 AUC-ROC for conversion prediction. (2) Logistic Regression—interpretable coefficients, fast training, baseline for comparison. (3) Deep Neural Networks—LSTM or Transformer architectures for sequence modeling; require larger datasets (>50K conversions) but capture complex temporal dependencies.
Hyperparameter tuning via cross-validation to optimize for business metric—not just accuracy. Objective function: Maximize ROAS prediction R² while constraining max channel credit to ≤40% (prevents over-attribution to single touchpoints).
Stage 4: Credit Allocation
Convert model outputs (conversion probabilities) into attribution weights. Three methods: (1) Shapley Value Attribution—allocates credit based on marginal contribution across all possible touchpoint combinations; computationally expensive but theoretically robust. (2) Removal Effect—measures conversion rate drop when specific touchpoint is excluded from journeys. (3) Marginal Contribution Scoring—calculates incremental lift from adding each touchpoint to baseline conversion probability.
Formula for Marginal Attribution: Crediti = [P(Conv|Touch1…n) – P(Conv|Touch1…i-1,i+1…n)] / Σ[P(Conv|Touch1…n) – P(Conv|Touch1…j-1,j+1…n)]
Validate via holdout incrementality tests: withhold 5–10% of spend from attributed high-value channels; measure actual conversion drop vs. model prediction. Target: ±5% agreement between predicted and observed incremental conversions.
Types of Machine Learning Attribution Models
Supervised Learning Models
Logistic Regression Attribution models conversion probability as a logistic function of touchpoint features. Coefficient interpretation: a 0.47 coefficient for “webinar attendance” means each webinar touch increases conversion log-odds by 0.47, equivalent to 1.6× odds multiplier. Strengths: fast training (<5 min for 100K records), interpretable weights, works with sparse data. Limitations: assumes linear relationships, requires manual interaction term engineering.
Random Forest/Gradient Boosting builds ensembles of decision trees to capture non-linear touchpoint interactions. XGBoost models achieve 12–18% higher predictive accuracy than logistic regression on complex B2B journeys (Salesforce State of Marketing 2026). Provides feature importance rankings—top 20% of features typically explain 80% of conversion variance. Ideal for: multi-product portfolios, long consideration cycles (>30 days), datasets with >10 touchpoint types.
Deep Learning Architectures
Recurrent Neural Networks (RNN/LSTM) process touchpoint sequences as time-series, maintaining “memory” of earlier interactions. Architecture: embedding layer (touchpoint type → 128-dim vector) → 2-layer LSTM (256 units) → attention mechanism (weighs touchpoint importance) → sigmoid output (conversion probability). Excels at: detecting long-range dependencies (initial brand search 90 days before conversion still receives appropriate credit), learning optimal time-decay functions from data.
Transformer-Based Models apply self-attention to weigh every touchpoint against every other simultaneously. Benefit: captures synergies missed by sequential models (e.g., concurrent email + paid social campaigns amplifying each other). Drawback: requires substantial compute (GPU training) and large datasets (>100K conversion paths). Enterprise use case: global B2B tech company deployed Transformer attribution on 2.3M customer journeys, discovered that display ads alone converted at 0.8% but display + organic search within 7 days converted at 3.2%—4× synergy effect.
Hybrid Ensemble Approaches
Combine multiple model types via stacking or blending. Architecture: train logistic regression (baseline), XGBoost (non-linearity), and LSTM (sequences) independently, then meta-model learns optimal weighted average of their predictions. Performance gain: 8–14% higher out-of-sample ROAS prediction accuracy vs. single-model approaches (Marketing Analytics Benchmark Study 2025). Implementation: use 5-fold cross-validation to generate meta-features, regularize meta-model to prevent overfitting to any single base learner.
Machine Learning Attribution Best Practices
Establish Data Governance and Quality Thresholds
Define minimum data standards before model deployment: ≥10 conversions per touchpoint type (avoid overfitting to rare channels), ≥90 days historical lookback (capture seasonality), <5% missing timestamp data, and ≥85% cross-device identity linkage. Implement automated data quality checks—flag campaigns with anomalous CTR (>3 standard deviations), detect duplicate tracking pixel fires, and validate UTM parameter consistency.
Create a centralized attribution data dictionary documenting: channel taxonomy (paid search vs. organic search definitions), conversion event definitions (MQL, SQL, Closed-Won), exclusion rules (internal traffic, bot filtering), and lookback window settings. Update quarterly as marketing mix evolves.
Start with Pilot Campaigns and Gradual Rollout
Phase 1 (Months 1–2): Select 2–3 high-volume channels (e.g., paid search, email, organic) representing 60%+ of conversions. Train baseline model, compare predictions against actual ROAS on 20% holdout set. Target: R² ≥0.65 for model acceptance.
Phase 2 (Months 3–4): Expand to full channel mix, integrate offline touchpoints (events, direct mail) via unique promo codes or call tracking. Conduct incrementality test on 1–2 channels: reduce spend by 15–20% in treatment geo, measure conversion drop, validate against model predictions. Success criteria: observed lift within 10% of predicted lift.
Phase 3 (Months 5–6): Operationalize model outputs—integrate attribution scores into BI dashboards, set up weekly automated reports showing channel credit trends, and create budget reallocation rules (e.g., shift 10% of budget from channels with <0.8× predicted ROAS to those >1.5×). Monitor for model drift: retrain monthly if prediction accuracy degrades >10%.
Combine ML Attribution with Causal Inference
ML models identify correlations but can’t prove causality. Augment with geo-holdout experiments, matched market tests, or causal impact analysis (Google’s CausalImpact package). Approach: use ML attribution to identify high-value touchpoints, then run controlled experiments to validate incremental lift. Example: ML attributes 22% credit to display ads; geo test shows only 12% incremental conversions when display is shut off—indicating 10% overattribution. Adjust model via calibration: multiply ML display credit by 0.55 (12%/22%) correction factor.
Adopt double machine learning (DML) frameworks for causal attribution: first-stage model predicts touchpoint exposure (propensity score), second-stage model estimates treatment effect controlling for selection bias. Result: unbiased attribution estimates robust to confounding variables (e.g., high-intent users more likely to see retargeting ads).
Implement Real-Time Score Updates and Automated Actions
Batch model retraining (monthly/quarterly) lags market dynamics. Transition to near-real-time scoring: ingest new conversion data daily, update model predictions hourly via online learning algorithms (e.g., Vowpal Wabbit). Stream attribution scores to activation platforms—Google Ads, Meta, email service providers—to trigger automated budget adjustments.
Workflow example: (1) ML model scores each ad campaign’s incremental ROAS every 6 hours; (2) if campaign ROAS <0.9× target for 48 consecutive hours, automated rule reduces daily budget by 20%; (3) if ROAS >1.3× target, increase budget by 15% (capped at 2× baseline to prevent overspend on anomalies). A/B test automated rules: 50% of campaigns use auto-bidding, 50% manual—measure aggregate ROAS lift. Typical result: 12–18% efficiency gain from automation.
Address Privacy and Compliance Requirements
GDPR, CCPA, and iOS ATT limit deterministic tracking. Strategies: (1) Probabilistic matching—use device fingerprinting, IP hashing, and behavioral patterns to link anonymous sessions; accuracy degrades 25–35% vs. cookie-based tracking. (2) Aggregated modeling—shift from user-level to cohort-level attribution; train models on aggregate conversion rates by channel×segment (e.g., “organic search for enterprise accounts converted 3.2% in Q4”). (3) Privacy-preserving ML—apply differential privacy (add calibrated noise to training data), federated learning (train models on decentralized data without centralizing PII), or synthetic data generation (create statistically similar but anonymized training sets).
Validate privacy impact: compare model accuracy on pre-ATT (2020) vs. post-ATT (2024) data. Industry average: 18–28% reduction in cross-device linkage, 12–16% decrease in conversion path completeness. Compensate via first-party data enrichment—incentivize email sign-ups, implement customer data platforms (CDPs) for identity resolution, and use contextual signals (content topic, time-on-site) as proxy features.
Frequently Asked Questions
How does Machine Learning Attribution differ from multi-touch attribution?
Multi-touch attribution (MTA) is a category encompassing both rule-based models (linear, time-decay, position-based) and algorithmic models (ML-driven). ML Attribution is a subset of MTA that replaces fixed credit rules with data-driven algorithms. Key distinction: rule-based MTA assigns predetermined percentages (e.g., 40% first touch, 40% last touch, 20% middle), while ML Attribution learns credit distribution empirically from conversion data. ML captures non-linear touchpoint interactions (synergies, diminishing returns) that rule-based models miss. Trade-off: ML requires larger datasets (minimum 5K–10K conversions for stable models) and technical expertise, whereas rule-based MTA deploys in days using standard analytics platforms.
What data volume is required to train accurate ML attribution models?
Minimum thresholds: (1) Conversions—10K+ for logistic regression/random forest, 50K+ for deep learning; (2) Touchpoints per conversion—average 8–12 interactions ensures sufficient signal; (3) Channel diversity—5–10 distinct touchpoint types prevents overfitting to single channel. For specialized models (account-based, product-specific), require 2K+ conversions per segment. Lower volumes (<5K conversions): use simpler models (logistic regression), aggregate low-frequency channels into “Other” category, or extend data collection period. Validation: if holdout test accuracy <0.70 AUC-ROC, dataset likely insufficient—consider hybrid approach combining rule-based baseline with ML adjustments for high-volume channels only.
How often should ML attribution models be retrained?
Retrain frequency depends on marketing velocity and seasonal patterns. Recommended cadence: (1) Monthly retraining for stable campaigns (evergreen content, consistent channel mix); (2) Weekly retraining for high-change environments (frequent campaign launches, A/B tests, promotional periods); (3) Event-triggered retraining for major shifts (new product launch, market expansion, algorithm updates on ad platforms). Monitor for drift: track prediction accuracy on most recent 7 days vs. model training period—if accuracy drops >15%, trigger immediate retrain. Automated pipeline: schedule model retraining jobs post-month-close (data completeness), validate on holdout set, deploy if performance ≥baseline, else rollback to prior version.
Can ML Attribution work with incomplete or anonymized data?
Yes, with adaptations. For incomplete data (missing touchpoints due to ad blockers, cross-device gaps): (1) train models on “complete” conversion paths (all touchpoints visible), then apply learned weights proportionally to partial paths; (2) use imputation techniques—predict missing touchpoints based on observed sequence patterns via Markov chain models or RNNs. For anonymized/aggregated data (privacy-compliant): (1) shift from user-level to segment-level modeling—train on aggregate conversion rates by channel×cohort; (2) apply synthetic data generation (GANs, SMOTE) to create privacy-safe training sets preserving statistical properties; (3) use contextual features (content type, referrer domain) as proxies for user identity. Accuracy trade-off: expect 10–20% reduction in predictive precision vs. fully deterministic tracking, but sufficient for directional budget optimization.
How do you validate ML attribution accuracy?
Five validation methods: (1) Holdout testing—reserve 15–20% of historical data, train model on remainder, measure prediction accuracy (RMSE, MAE, R²) on holdout; target R² ≥0.65 for ROAS prediction. (2) Geo-holdout experiments—withhold marketing spend in 10–15% of geographic regions for 4–8 weeks, compare actual conversion drop vs. model-predicted attribution loss; ideal agreement ±10%. (3) Cross-model validation—compare ML attribution with Markov Chain and Shapley Value models; if agreement on top-3 channels >80%, high confidence. (4) Incrementality lift tests—run brand lift studies, conversion lift tests via platform experiments (Google Ads, Meta); correlate ML-attributed channel value with measured incremental lift. (5) Business outcome validation—reallocate 10–20% of budget according to ML recommendations, measure aggregate ROAS change; positive lift confirms model utility. Industry benchmark: validated models achieve 82–91% agreement with controlled experiments vs. 68–74% for rule-based models (Forrester Marketing Measurement Study 2025).
What is the ROI timeline for implementing ML Attribution?
Typical implementation: 12–16 weeks from kickoff to operationalized insights. Phase 1 (Weeks 1–4): data audit, integration, and quality remediation—consolidate cross-channel data, resolve identity linkage, standardize taxonomy. Phase 2 (Weeks 5–8): model development and validation—feature engineering, algorithm selection, hyperparameter tuning, holdout testing. Phase 3 (Weeks 9–12): pilot deployment—run parallel to existing attribution, conduct incrementality validation, build stakeholder dashboards. Phase 4 (Weeks 13–16): full rollout and optimization—integrate into budget planning, automate score updates, establish retraining cadence. ROI realization: early wins (15–20% ROAS improvement on optimized channels) visible by Week 10–12; full portfolio optimization gains (18–32% efficiency lift) materialize 6–9 months post-deployment as models learn seasonal patterns and team workflows adapt. Ongoing cost: 0.5–1.0 FTE for model maintenance, $2K–$10K/month for data infrastructure (warehouse, ML compute), plus platform fees if using vendor solutions.
How does ML Attribution integrate with Marketing Mix Modeling (MMM)?
ML Attribution and MMM are complementary: attribution provides granular, bottom-up touchpoint credit using individual customer journeys; MMM offers top-down, aggregate channel contribution using time-series regression on sales and marketing spend. Integration approach: (1) Two-stage modeling—use MMM to determine total incremental conversions by channel (accounting for baseline, seasonality, macroeconomic factors), then use ML attribution to allocate that incremental volume across sub-channels and campaigns within each channel. (2) Calibration—adjust ML attribution weights using MMM-derived channel multipliers; if MMM indicates paid search drives 22% of incremental conversions but ML attributes 30%, apply 0.73× calibration factor (22%/30%) to ML paid search credit. (3) Unified forecasting—feed ML attribution touchpoint coefficients as inputs to MMM to improve forecast granularity (predict not just “increase TV by 15%” but “increase TV prime time by 20%, reduce daytime by 10%”). Best practice: run MMM quarterly for strategic planning (budget allocation across channels), use ML attribution weekly for tactical optimization (campaign-level bidding, creative rotation).