
TL;DR
- Test and Control is the experimental framework that randomly divides an audience into an exposed test group and a withheld control group to isolate the true incremental impact of a marketing campaign.
- It is the only methodology that establishes causality in marketing measurement — replacing correlation-based attribution with provable, experiment-derived ROI.
- CMOs who deploy test and control systematically uncover 30–50% ROAS inflation in their attribution models, unlocking budget reallocation that cuts blended CAC by 15–30% without increasing total spend.
What Is Test and Control?
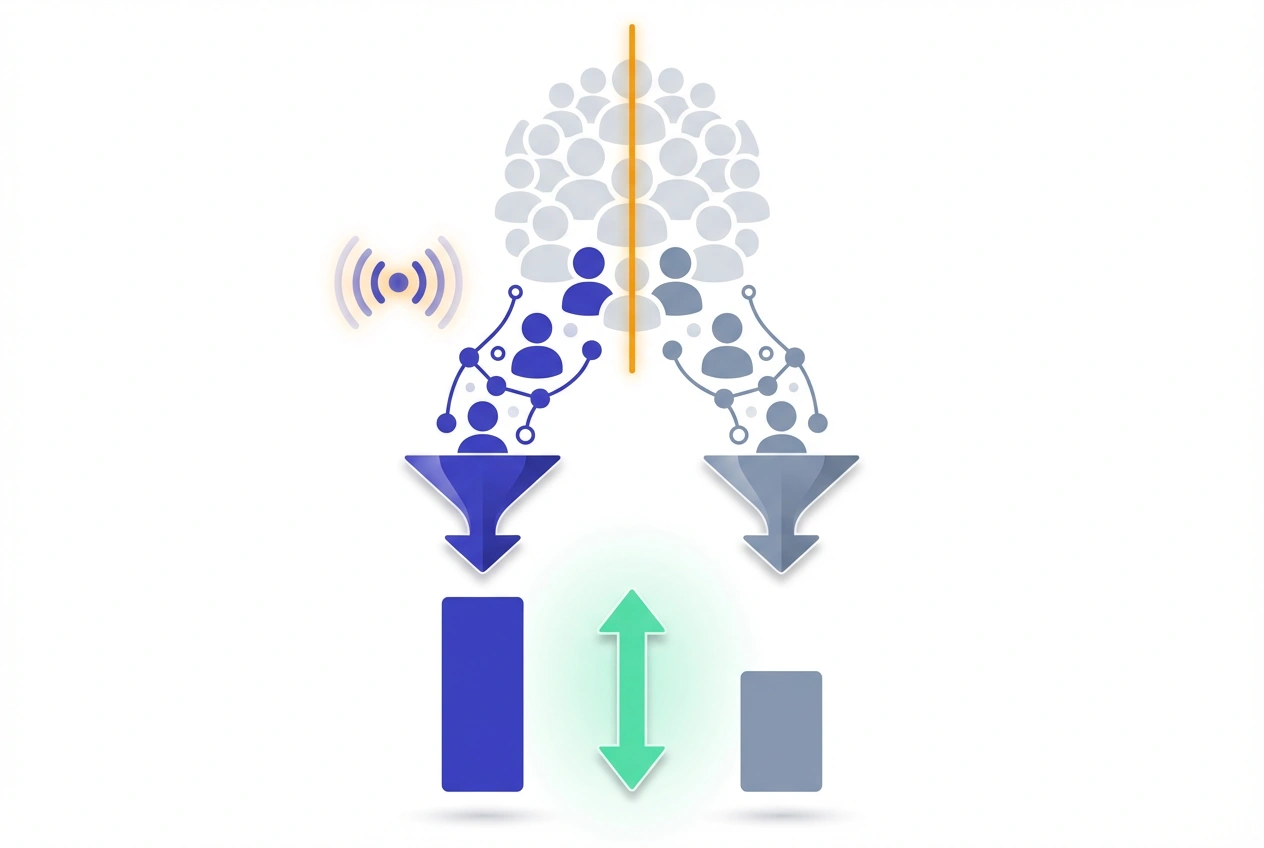
Test and Control is a randomized controlled experimental design in which a target audience is divided into two mutually exclusive groups: the test group (exposed to the campaign) and the control group (withheld from all campaign exposure) to measure the incremental effect of marketing activity.
The control group establishes the organic baseline conversion rate — the share of users who would have converted regardless of marketing spend. The test group’s performance above that baseline is the only defensible measure of incremental lift.
Where attribution models observe and distribute credit, test and control experiments prove causation. That distinction is the difference between optimizing the appearance of performance and optimizing actual performance.
Test LeadSources today. Enter your email below and receive a lead source report showing all the lead source data we track—exactly what you’d see for every lead tracked in your LeadSources account.
How Test and Control Works
The architecture is borrowed directly from clinical trial methodology — randomized controlled trial (RCT) design applied to marketing audiences.
Before campaign launch, the total target audience is split randomly into two cells:
- Test group — typically 80–90% of the audience, receiving full campaign exposure as planned.
- Control group — typically 10–20%, deliberately excluded from all campaign touchpoints for the full study window.
Both groups run in parallel through identical time windows and market conditions. At study close, incremental impact is calculated across three metrics:
- Absolute Lift = CVRtest − CVRcontrol
- Relative Lift (%) = [(CVRtest − CVRcontrol) / CVRcontrol] × 100
- Incremental Conversions = (CVRtest − CVRcontrol) × Total Test Group Users
Worked example: A B2B SaaS email nurture campaign targets 20,000 contacts. CVRtest = 5.1%; CVRcontrol = 3.4%.
- Absolute Lift = 1.7 percentage points
- Relative Lift = (1.7 / 3.4) × 100 = 50%
- Incremental Conversions = 0.017 × 20,000 = 340 leads
- At $17,000 spend: Incremental CPL = $50
The control group’s 3.4% CVR confirms that nearly two-thirds of total conversions would have occurred without the campaign. Without this structure, all 1,020 conversions would have been attributed to the email program — a 200% overstatement of its actual impact.
Why It Matters for Lead Attribution
Every touchpoint-based attribution model — last-click, linear, time-decay, or data-driven — shares the same structural flaw: it records which channels were present at conversion and distributes credit among them.
None can answer the counterfactual. None can tell you how many of those conversions would have happened without any campaign at all.
Test and control fills that gap precisely. The counterfactual conversion rate — produced by the control group — is the single number that transforms attribution from a reporting exercise into a capital allocation tool.
Analytic Partners’ cross-industry research shows that attribution-reported ROAS overstates true incremental ROAS by 30–50% on average. For a $2M annual media budget, that gap translates to $600K–$1M in misallocated spend per year.
For lead generation programs, the implications extend beyond CPL. Tracking MQL-to-SQL conversion rates and LTV by cohort — test versus control — through the CRM reveals whether a channel drives qualified pipeline or just submission volume. A program showing 40% CVR lift with flat downstream MQL-to-SQL rates is adding CRM noise, not revenue.
Test and Control Design Variants
Not all test-and-control experiments use the same structural approach. Design choice materially affects result validity and operational feasibility.
| Design Type | Control Group Construction | Ideal Use Case | Key Limitation |
|---|---|---|---|
| User-Level Randomization | Individual users randomly assigned to test or control cell | Email, paid social, CRM-triggered campaigns | Auction distortion; CPM inflation in paid channels |
| Ghost Ads (Bid-to-Lose) | Platform bids in auction for control users but intentionally loses | Paid social incrementality (Meta, select DSPs) | Requires platform support; not universally available |
| Geo-Based Split | Markets randomly assigned to test or control regions | TV, OOH, radio, broad awareness programs | Geographic spillover between adjacent regions |
| Time-Based (Dark Period) | Campaign paused for a defined window; pre/post comparison | Always-on channels — SEO, organic email | External confounders: seasonality, competitive activity |
| Account-Level Split | Named accounts assigned to test or control lists | ABM programs, enterprise demand generation | Requires clean account segmentation; small N challenge |
For B2B paid programs, ghost ads are structurally superior to user-level exclusions because they preserve competitive auction dynamics and eliminate the CPM inflation that skews cost comparisons between test and control cells.
Statistical Requirements for Valid Results
A test-and-control experiment without statistical rigor is not a measurement program — it is anecdote with expensive branding. Test and control validity lives or dies on sample size adequacy.
Minimum sample size per cell is governed by:
n = (Z² × p(1 − p)) / MDE²Where Z = 1.96 (95% confidence), p = baseline CVR of the control group, and MDE = the minimum detectable effect as an absolute percentage point difference.
Sample size reference for B2B lead programs:
| Control Group CVR | Relative MDE | Users Required / Cell (95% CI, 80% Power) |
|---|---|---|
| 1.0% | 20% | ~38,400 |
| 2.0% | 20% | ~19,200 |
| 3.0% | 20% | ~12,700 |
| 5.0% | 20% | ~7,500 |
B2B programs with sub-2% baseline CVRs — common in enterprise demand generation — face a structural challenge: required cell sizes frequently exceed the reach of a single campaign cycle. Geo-based splits or extended 8–12 week windows are the operationally viable response.
Implementing a Test-and-Control Study: 6-Step Framework
- Pre-register the experiment before launch — document primary KPI (MQLs, SQLs, pipeline value), MDE, confidence threshold, control group size, and study duration in a signed-off test plan. Changing any parameter mid-test invalidates the result.
- Size control and test cells correctly — apply the sample size formula. If reach is insufficient, extend the window or switch to a geo-based design rather than reducing control group size below the statistical minimum.
- Use platform-native or third-party randomization — Meta Experiments, Google Ads Conversion Lift, or measurement vendors (Measured, Rockerbox, Nielsen) provide validated cell construction. Manual list segmentation introduces selection bias that compromises the entire study.
- Lock the study window — no early stopping — interim peeking and early termination inflate Type I error rates by up to 26% (Kohavi et al., Microsoft Research). Set the end date before go-live and enforce it regardless of early results.
- Tag all leads with cohort status at capture — assign test/control membership at the point of form submission and sync the tag to the CRM immediately. Retrofitting cohort attribution after the campaign ends is operationally unreliable and destroys downstream pipeline analysis.
- Analyze results across the full funnel — CVR lift at form submission is the opening data point, not the conclusion. Compare Incremental CPL, Incremental ROAS, MQL-to-SQL rates, average deal size, and LTV by cohort before making any budget recommendation.
Common Design and Execution Errors
Most test-and-control failures trace back to five systematic errors, each of which corrupts results in a different direction. Recognizing these patterns is prerequisite to running test and control at the governance level required for executive decision-making.
- Control group contamination — control users exposed to the campaign through retargeting pools, lookalike overlaps, or organic brand content exhibit inflated baseline CVRs, compressing measured lift toward zero. Post-study contamination audits against ad exposure logs are mandatory.
- Peeking and early stopping — checking live results and ending the study when numbers look favorable is the single most common source of false-positive findings in marketing experimentation. The discipline to hold the study window is a governance issue, not a technical one.
- Novelty effect inflation — new channels, creatives, or audience segments consistently show elevated short-term lift that regresses to mean within 4–6 weeks. Always run studies through a minimum of one complete conversion cycle.
- Top-of-funnel-only analysis — CVR lift at the lead stage tells half the story. A channel generating 35% form-submission lift with a 10% MQL-to-SQL rate is underperforming against a channel generating 15% lift with a 40% MQL-to-SQL rate. Total pipeline impact, not lead volume, is the correct unit of analysis.
- Single-test conclusions — audience behavior, competitive environment, creative fatigue, and seasonality shift incrementality baselines every quarter. Programs that run test and control once and stop generating insights with 6–12 month expiry dates at best.
Test and Control Best Practices
Sustained competitive advantage in marketing measurement comes from institutionalizing test-and-control discipline, not running one-off experiments. The organizations that treat test and control as a calendar-governed program — not a reactive tool — consistently outperform peers on CAC efficiency.
- Build a test-and-control governance calendar — schedule quarterly experiments by channel at the start of each fiscal year. Channel-level incrementality data should be refreshed on the same cadence as budget planning cycles.
- Test one variable per study — simultaneous changes to channel, creative, and audience targeting within a single study make it statistically impossible to isolate the variable driving lift. One experiment, one change.
- Embed cohort tagging in the lead capture stack — test/control status must be written to the CRM at the moment of form submission, not reconstructed post-campaign. This requires coordination between campaign operations and CRM administration before launch.
- Calibrate MTA models using experiment outputs — use test-and-control Incremental ROAS by channel to recalibrate multi-touch attribution credit weights. When MTA-reported ROAS exceeds experiment-measured Incremental ROAS by more than 25%, the attribution model is systematically over-crediting that channel.
- Pair with Marketing Mix Modeling — MMM provides strategic budget guidance at the channel-portfolio level; test and control provides channel-level causal validation at the campaign level. The two methods eliminate complementary blind spots and should operate in parallel, not in sequence.
- Adopt Bayesian frameworks for always-on channels — frequentist designs require fixed study windows incompatible with continuously running programs. Bayesian adaptive testing allows ongoing measurement without inflating false-positive rates, making it the correct methodology for always-on demand generation.
Frequently Asked Questions
What is the difference between test and control and A/B testing?
A/B testing compares two variations of a campaign element — creative, subject line, landing page — within an already-exposed audience to optimize execution. Test and control compares a campaign-exposed group against a non-exposed group to determine whether running the campaign at all generates incremental conversions. A/B testing answers “which version works better?”; test and control answers “does this campaign work at all?”
How do you determine the right control group size?
Control group size is derived from the sample size formula — not a fixed percentage. At a 2% baseline CVR, 20% relative MDE, 95% confidence, and 80% statistical power, each cell requires approximately 19,200 users. The conventional 10–20% control group is a practical starting point, but programs with low CVRs may require 25–30% allocation to the control cell to achieve adequate statistical power.
Does withholding the control group cost incremental revenue?
The opportunity cost is bounded and quantifiable: a 10% control allocation on a campaign generating $1M in pipeline withholds at most $100K in potentially incremental pipeline — and only the lift-attributable portion at that. The alternative — continuing to invest in zero-lift channels validated only by attribution reporting — typically misallocates 20–40% of total media budget indefinitely. The cost of measurement is structurally lower than the cost of ignorance.
What is the difference between test and control and incrementality testing?
Test and control is the experimental mechanism — the random group split and outcome comparison methodology. Incrementality testing is the broader measurement objective — determining the causal impact of marketing activity on conversions. All test-and-control experiments are incrementality tests; but incrementality programs can also use synthetic control methods, difference-in-differences models, or econometric approaches that do not require a randomized control group.
Which platforms support native test-and-control functionality?
Meta provides Conversion Lift through its Experiments tool with ghost ad holdout support. Google Ads offers Conversion Lift and Brand Lift studies. LinkedIn Campaign Manager supports audience segment comparisons with limited native control group infrastructure. For cross-channel or CRM-integrated studies, third-party vendors — Measured, Rockerbox, and Nielsen — provide platform-agnostic holdout cell construction and unified multi-channel reporting.
How should test-and-control results inform annual budget allocation?
Use Incremental ROAS — not platform-reported ROAS — as the primary budget allocation signal. Rank channels by Incremental CPL relative to target CAC, then reallocate budget from below-threshold channels toward the highest-lift, lowest-incremental-CPL programs. Systematic reallocation based on experiment-derived Incremental ROAS typically reduces blended CAC by 15–30% in the first planning cycle. Treat attribution-reported ROAS as directional only until validated by test-and-control measurement.
How do you handle test-and-control results that show zero or negative lift?
Zero lift means the channel claims attribution credit for conversions that would have occurred organically — the campaign spend is ineffective at the margin. Negative lift indicates the campaign may be disrupting organic conversion pathways, a pattern frequently observed in over-frequency retargeting. Both outcomes warrant immediate spend reduction or pause, followed by creative refresh or audience restructure, before retesting. Neither result should be rationalized away using attribution-reported metrics that do not account for the organic baseline.