
TL;DR
- Geo-Lift Testing quantifies true incremental campaign impact by splitting matched geographic regions into treatment and holdout groups and measuring the conversion delta between them.
- It is the gold-standard causal measurement method for channels that resist user-level randomization—CTV, DOOH, broadcast, and iOS-impacted paid social.
- CMOs relying on MTA or last-click attribution alone risk overstating channel ROAS by 30–50%; geo-based incrementality tests remove that systematic bias.
What Is Geo-Lift Testing?
Geo-Lift Testing is a controlled causal measurement methodology that isolates the incremental impact of a marketing campaign by comparing lead and conversion outcomes across geographically matched treatment and holdout regions.
Unlike probabilistic attribution models—MTA, last-click, or data-driven—it produces a directly observable, statistically validated lift delta between exposed and unexposed populations.
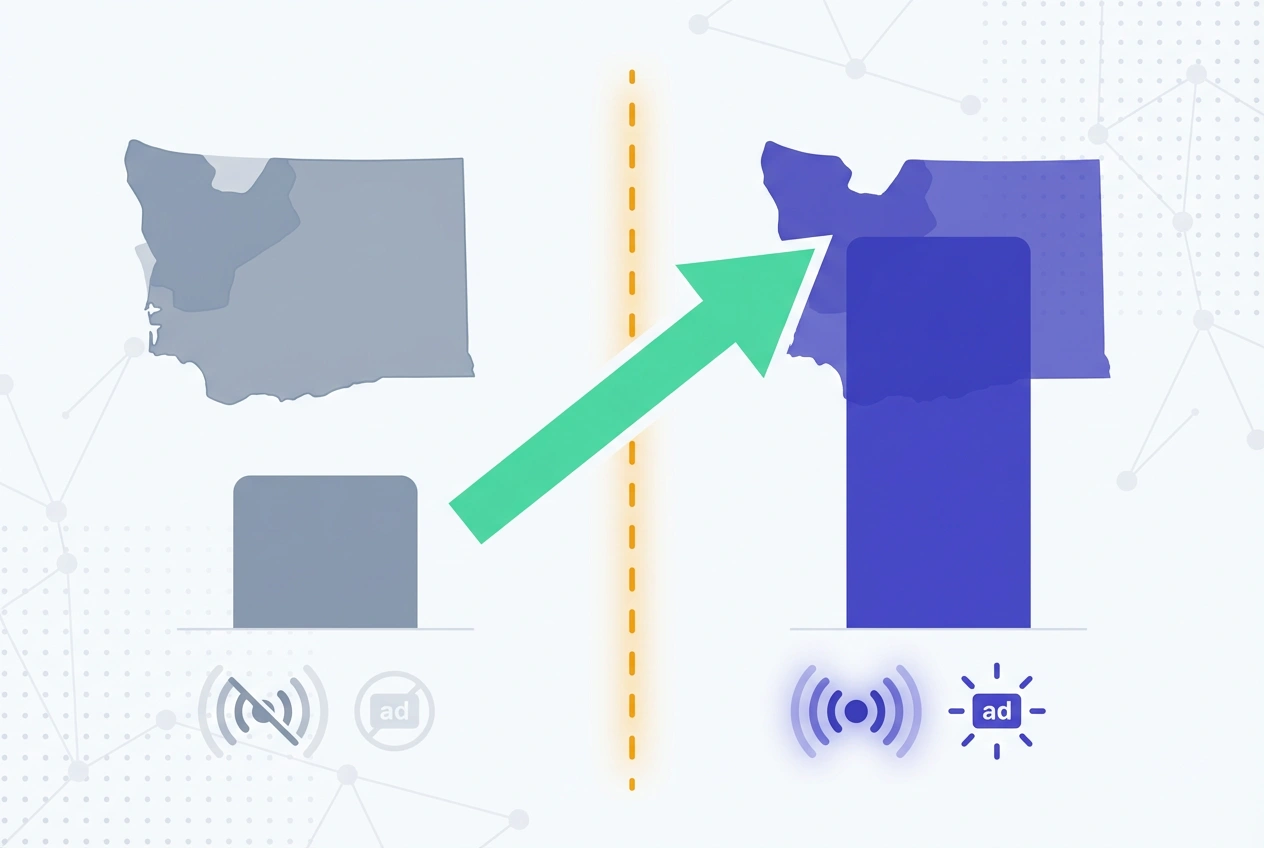
The treatment region receives full campaign delivery; the holdout region is dark or served ghost ads. Post-test lift equals the conversion rate difference between groups, normalized for pre-test baseline variance.
This makes Geo-Lift Testing especially powerful for channels where IDFA deprecation, cookie restrictions, or the absence of digital identifiers make user-level attribution structurally impossible.
Test LeadSources today. Enter your email below and receive a lead source report showing all the lead source data we track—exactly what you’d see for every lead tracked in your LeadSources account.
How Geo-Lift Testing Works
The methodology follows a geographic test-and-control architecture. Regions—DMAs, zip code clusters, Nielsen markets, or countries—are matched on historical CVR, demographic composition, and aggregate market size before randomized assignment.
Matching quality is the single most important design variable. Poorly matched geo pairs introduce confounding variance that inflates or deflates measured lift, producing results with no statistical basis for budget decisions.
During the test window, campaign delivery proceeds normally in the treatment region while the holdout region remains suppressed. CRM pipeline data, web analytics conversions, and offline lead records are captured independently per region throughout.
Core lift formulas:
- Absolute Lift = CVR (Treatment) − CVR (Control)
- Relative Lift % = [Absolute Lift ÷ CVR (Control)] × 100
- Incremental Leads = Absolute Lift × Exposed Population
- Incremental CPL = Total Campaign Spend ÷ Incremental Leads
Why It Matters for Lead Attribution
Touchpoint-based attribution assigns credit based on observed interactions, not causal impact. A lead attributed to paid social may have converted organically without ever seeing the ad—attribution models cannot distinguish the two.
Geo-Lift Testing answers the counterfactual directly: would this lead have converted without the campaign? That answer is what drives defensible CAC calculations and credible channel ROI presentations to the CFO.
For B2B SaaS demand generation programs, the stakes are material. Gartner research indicates that 60–70% of the B2B buyer journey occurs before direct sales engagement, meaning upper-funnel channel influence is systematically underweighted in touchpoint-centric MTA models.
Geo-Lift Testing outputs fed into MMM as calibration data close the loop between econometric modeling and controlled experimentation—improving budget allocation precision by 20–40% according to Meta Marketing Science benchmarks.
Designing a Valid Study
Geo-Lift Testing validity hinges on four design variables: region matching quality, minimum detectable effect (MDE), test duration, and contamination management.
Region selection should rely on statistical matching algorithms—propensity scoring or synthetic control methods—not manual assignment. Google GeoX and Meta’s open-source GeoLift tool both automate this process with pre-test power analysis built in.
Statistical power at the geo level requires sufficient aggregate conversion volume per region pair (β ≥ 0.80, α ≤ 0.05). For B2B programs with CVRs below 1%, this typically means a minimum of 8–12 matched region pairs and 100–200 conversions per cell.
Test duration must span at least two full demand consideration cycles. Enterprise SaaS programs with 60–90-day sales cycles risk significant MQL-to-SQL undercounting if the observation window closes before downstream pipeline conversions materialize.
Contamination risk—holdout exposure via spillover media, cross-border travel, or shared IP environments—must be modeled pre-launch. Urban DMAs adjacent to treatment zones carry the highest spillover probability and should use 15–25-mile buffer exclusion zones.
Calculating Incremental Results
Geo-Lift Testing post-analysis requires normalizing raw lead counts for population size and pre-test baseline differences between matched regions.
| Metric | Treatment Region | Control Region |
|---|---|---|
| Exposed Population | 50,000 | 50,000 |
| Leads Generated | 600 | 400 |
| Conversion Rate | 1.20% | 0.80% |
| Absolute Lift | 0.40% | |
| Relative Lift | 50% | |
| Incremental Leads | 200 | |
| Incremental CPL (at $40K spend) | $200 | |
| Attributed CPL (all 600 leads) | $66.67 | |
The 3× gap between attributed CPL ($66.67) and incremental CPL ($200) is the core finding Geo-Lift Testing surfaces—the overstatement magnitude CMOs carry when relying on touchpoint attribution alone.
Only 200 of the 600 attributed leads were causally driven by the campaign; the other 400 would have converted regardless of spend.
Industry Benchmarks
Geo-based lift ranges vary by channel, competitive density, and funnel stage.
| Channel | Typical Geo-Lift Range | Confidence Threshold |
|---|---|---|
| Paid Search — Brand | 40–65% | 90–95% |
| Paid Search — Non-Brand | 20–40% | 85–92% |
| Paid Social — B2B SaaS | 15–35% | 80–90% |
| Connected TV / OTT | 8–20% | 75–85% |
| Display / Programmatic | 5–15% | 70–80% |
| Out-of-Home (DOOH) | 3–10% | 65–75% |
Sources: Nielsen Ad Intel, Meta Marketing Science, Google Ads incrementality research. Results vary with creative quality, market saturation, and competitive ad density.
Common Design Errors
- Under-powered region pools: Fewer than 6 matched region pairs produces insufficient statistical power to detect realistic MDE thresholds of 10–15%.
- Ignoring seasonality: Launching during atypical demand windows—product launches, fiscal year-end pushes—corrupts baseline comparison integrity.
- Truncated test windows: Sub-3-week tests miss demand latency effects, systematically underreporting lift for consideration-stage campaigns.
- Post-hoc metric selection: Defining success criteria after results are visible introduces p-hacking risk and destroys executive credibility of findings.
- Single-metric analysis: Measuring leads only—without downstream MQL, SQL, pipeline value, and CAC—produces an incomplete incrementality picture that misleads budget decisions.
- Platform-only measurement: Relying on a single ad platform’s native lift tool introduces in-platform attribution bias; cross-channel geo tests require platform-agnostic measurement.
Geo-Lift Testing Best Practices
- Pre-register all KPIs, MDE thresholds, and significance targets (α ≤ 0.05, β ≥ 0.80) before any campaign delivery begins.
- Use automated geo-matching tools—Google GeoX, Meta’s GeoLift R package—to eliminate human selection bias in region assignment.
- Extend the analysis window beyond the test period to capture lagged MQL-to-SQL and SQL-to-pipeline conversions.
- Run full-funnel incrementality: leads → MQLs → SQLs → pipeline value → CAC per channel, not just top-of-funnel volume.
- Integrate geo-lift outputs into MMM as ground-truth calibration data to reduce econometric model uncertainty.
- Tag test-region leads in CRM with geo-experiment identifiers at ingestion to enable post-test cohort attribution analysis.
- Schedule quarterly re-tests for channels above $50K/month in spend to account for creative fatigue and market saturation drift.
Frequently Asked Questions
How does Geo-Lift Testing differ from standard A/B testing?
Standard A/B testing randomizes at the individual user level; Geo-Lift Testing randomizes at the geographic region level. This makes it the appropriate methodology for channels—CTV, DOOH, radio, and iOS-heavy paid social—where individual user identification is structurally unavailable or legally restricted.
What minimum conversion volume is required to run a valid study?
Each matched region pair needs a minimum of 100–200 conversions per cell over the test window to achieve 80% statistical power at a 10% MDE. B2B programs with CVRs below 0.5% should extend test duration to 6–8 weeks or increase the number of matched region pairs to concentrate sufficient volume.
Can geo-lift results calibrate MMM models?
Yes—this is one of the highest-ROI applications of geo-lift data. Outputs serve as ground-truth incrementality anchors that constrain MMM regression coefficients, reducing budget optimization uncertainty ranges by 20–40% per Meta Marketing Science research. Without geo-lift calibration, MMM models can misallocate budgets by the same magnitude they claim to optimize.
How is holdout contamination managed in dense urban markets?
Contamination is controlled through 15–25-mile geographic buffer exclusion zones around region boundaries, frequency capping in border zip codes, and statistical contamination-rate adjustments applied post-test. Platform-native tools like Meta GeoLift model spillover probability automatically; custom studies require manual contamination estimation built into the lift formula.
Which platforms natively support this incrementality method?
Google Ads (GeoX), Meta Ads Manager (Conversion Lift with geo-split configuration), and The Trade Desk offer native geo-lift frameworks. For cross-channel or offline-heavy programs, Meta’s open-source GeoLift R package enables platform-agnostic multi-region analysis without walled-garden attribution bias.
How should incrementality findings inform annual budget allocation?
Incremental CPL derived from geo-lift tests should replace attributed CPL as the primary efficiency metric in budget models. Channels generating high attributed volume but sub-10% incremental lift—display retargeting, branded paid search—should be rebalanced in favor of channels demonstrating causal lead generation at acceptable incremental CAC thresholds.
How does Geo-Lift Testing interact with multi-touch attribution models?
Geo-lift results serve as calibration inputs for MTA models, correcting for the systematic over-attribution bias inherent in touchpoint-based systems. Running a geo-lift study alongside an active MTA deployment allows teams to calculate an “inflation factor” per channel—quantifying exactly how much MTA is overstating each channel’s true incremental contribution to pipeline.