
TL;DR
- Holdout Testing isolates true campaign impact by withholding a randomly selected audience segment from marketing exposure and comparing their conversion rate against the exposed group.
- It is the only method that establishes causality in marketing measurement — distinguishing leads your campaigns generated from leads that would have arrived organically.
- Programs that implement holdout tests systematically identify 30–50% ROAS overstatement in their existing attribution models, enabling budget reallocation that reduces blended CAC by 15–30%.
What Is Holdout Testing?
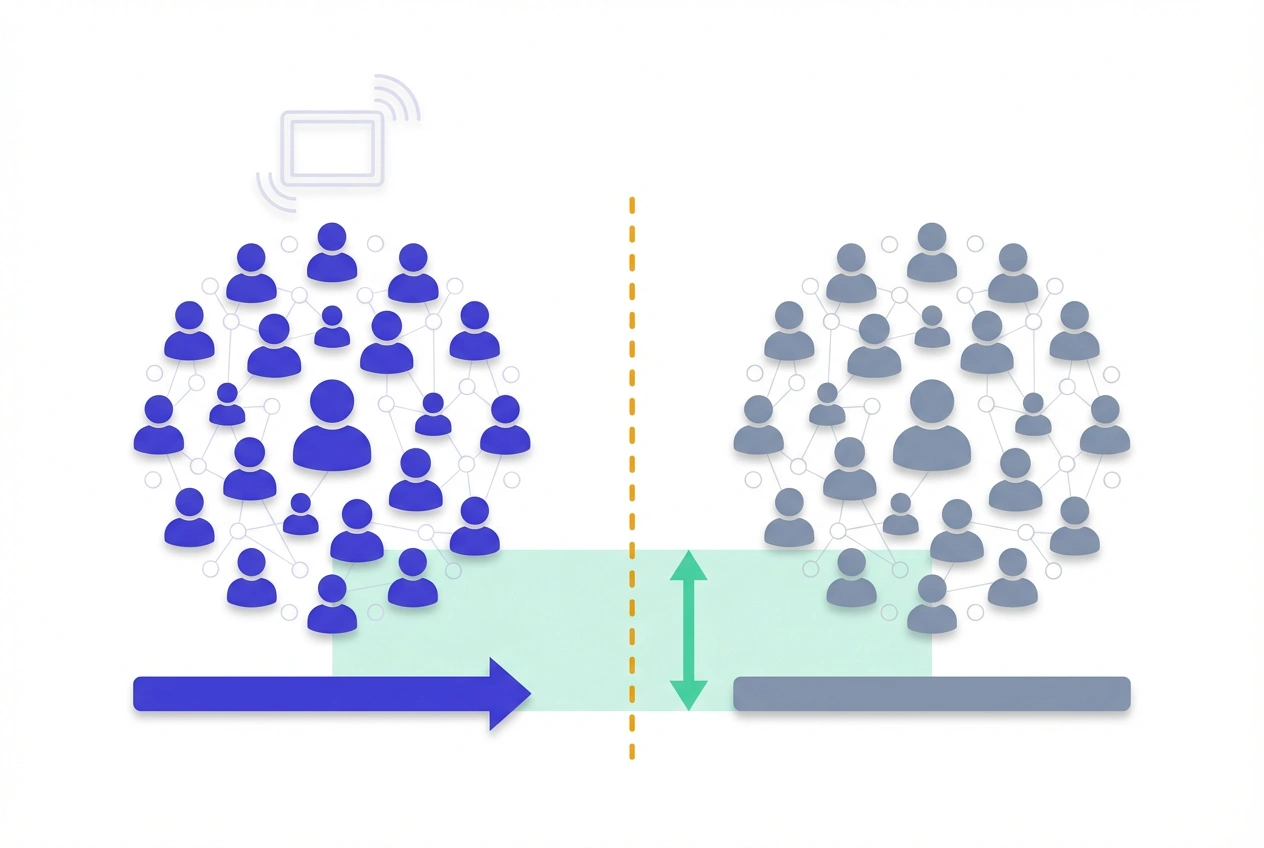
Holdout Testing is a controlled experimental design in which a randomly selected subset of the target audience — the holdout group — is deliberately excluded from a campaign, while the remainder receives normal exposure.
By comparing the conversion rates of both groups over the same measurement window, marketers isolate the incremental lift attributable to the campaign itself, stripping out organic conversions that would have occurred regardless of spend.
Unlike last-touch, linear, or data-driven attribution models — which distribute credit based on observed touchpoints — holdout testing answers the only question that matters for budget allocation: did this campaign cause additional conversions, or did it merely witness them?
Test LeadSources today. Enter your email below and receive a lead source report showing all the lead source data we track—exactly what you’d see for every lead tracked in your LeadSources account.
How Holdout Testing Works
The mechanics are grounded in randomized controlled trial (RCT) methodology, adapted for digital marketing environments.
Before campaign launch, the total addressable audience is randomly segmented into two mutually exclusive cells:
- Exposed group (treatment cell) — typically 80–90% of the audience, receiving campaign impressions as planned.
- Holdout group (control cell) — typically 10–20% of the audience, receiving no campaign exposure for the study’s duration.
Both groups are tracked independently through the same conversion window. The incremental impact is derived from three core calculations:
- Absolute Lift = CVRexposed − CVRholdout
- Relative Lift (%) = [(CVRexposed − CVRholdout) / CVRholdout] × 100
- Incremental Conversions = (CVRexposed − CVRholdout) × Total Exposed Users
Worked example: A B2B demand generation campaign targets 30,000 users. CVRexposed = 3.6%; CVRholdout = 2.4%.
- Absolute Lift = 1.2 percentage points
- Relative Lift = (1.2 / 2.4) × 100 = 50%
- Incremental Conversions = 0.012 × 30,000 = 360 leads
- At $36,000 spend: Incremental CPL = $100
The holdout group’s CVR establishes the organic baseline — the irreducible conversion rate driven by brand awareness, direct search, or other pre-existing demand that no campaign spending created.
Why It Matters for Lead Attribution
Attribution models are directionally useful but structurally flawed for causal analysis.
Every touchpoint-based model — regardless of sophistication — observes that certain channels co-occurred with conversions and distributes credit accordingly. None can determine whether removing that channel would have changed the outcome.
Holdout testing closes this gap. It provides the counterfactual that attribution cannot: the conversion rate in a world where the campaign never ran.
The business consequence of skipping holdout measurement is systematic over-investment. Analytic Partners’ cross-industry analysis shows that attribution-reported ROAS overstates true incremental ROAS by 30–50% on average — meaning a channel reporting $4 ROAS may be delivering only $2–$2.80 in incremental return.
For lead generation programs specifically, holdout testing surfaces a second dimension: lead quality. Tracking MQL-to-SQL rates, average deal size, and LTV for exposed and holdout cohorts through the CRM reveals whether a channel is generating pipeline — or generating form submissions from unqualified audiences.
Holdout Group Architectures
The validity of a holdout test depends heavily on how the control cell is constructed. Holdout testing architecture selection is the single most consequential design decision in any incrementality program.
Four distinct architectures exist, each with specific trade-offs.
| Architecture | Method | Best Application | Primary Risk |
|---|---|---|---|
| User-Level Holdout | Individual users randomly excluded from targeting | Paid social, email, retargeting | Auction distortion; CPM inflation for exposed group |
| Ghost Ads (Bid-to-Lose) | Platform enters auction for holdout users but bids to lose intentionally | Meta, select DSPs — paid social lift | Limited to platforms supporting ghost bidding |
| Geo-Split Holdout | Geographic markets randomly assigned to treatment vs. control | TV, OOH, broad awareness campaigns | Market-level spillover between adjacent regions |
| Time-Based (Dark Period) | Campaign suspended for a defined window; pre/post comparison | Always-on channels (SEO, email) | External confounders — seasonality, competitors, news events |
Ghost ads are the architecturally superior choice for paid social programs because they preserve competitive auction dynamics and prevent the CPM inflation that standard user-exclusion holdouts introduce.
Designing a Statistically Valid Holdout Test
Statistical validity is not optional — it is the entire point. An underpowered holdout test is more damaging than no test because it generates false confidence in flawed conclusions. Holdout testing without statistical power is theater, not measurement.
Minimum sample size per cell is determined by:
n = (Z² × p(1 − p)) / MDE²Where Z = 1.96 (95% confidence), p = baseline CVR of the holdout group, and MDE = the minimum detectable effect expressed as an absolute percentage point difference.
Reference table for B2B lead generation programs:
| Baseline CVR | Relative MDE Target | Required Users / Cell (95% CI, 80% Power) |
|---|---|---|
| 1.0% | 20% | ~38,400 |
| 2.0% | 20% | ~19,200 |
| 3.0% | 20% | ~12,700 |
| 5.0% | 20% | ~7,500 |
B2B programs with sub-2% baseline CVRs require large audience pools that often exceed a single campaign’s reach. In these cases, extending the test window to 6–10 weeks or adopting a geo-split design is the practical alternative.
Implementing a Holdout Test: Step-by-Step
- Define success criteria before launch — document the primary KPI (form submissions, MQLs, pipeline value), minimum acceptable lift, and required confidence level in a pre-registered test plan. Post-hoc metric selection is p-hacking by another name.
- Calculate required sample size — apply the formula above. If reach is insufficient, adjust test duration or holdout architecture before starting — not mid-test.
- Construct holdout cell using platform-native tools or third-party infrastructure — Meta Experiments, Google Ads Conversion Lift, or vendors like Measured and Rockerbox provide validated randomization. Manual audience segmentation introduces selection bias.
- Enforce a strict no-peek policy — early access to interim results and stopping when significance appears inflates Type I error rates by up to 26% (Kohavi et al., Microsoft Research). Set a fixed end date and do not deviate.
- Tag holdout and exposed leads individually in the CRM — the most common implementation failure is losing cohort attribution after the form submission. Tag each lead with holdout/exposed status at capture so MQL, SQL, and closed-won rates can be compared downstream.
- Report at every funnel stage — top-of-funnel CVR lift is the starting point, not the conclusion. Calculate Incremental CPL, Incremental ROAS, and downstream pipeline differences before issuing budget recommendations.
Common Holdout Testing Mistakes
Most holdout test failures are design failures, not measurement failures. Understanding the structural vulnerabilities in holdout testing design is prerequisite to running credible experiments.
- Contaminated holdout cells — holdout users exposed to the campaign through retargeting, lookalike audiences, or organic brand posts will exhibit higher-than-true baseline CVRs, compressing measured lift toward zero. Post-test contamination audits are non-negotiable.
- Undersized control groups — holdout groups below 10% of the total audience frequently lack statistical power, especially in B2B programs with long conversion windows and low CVRs.
- Novelty effect misinterpretation — new channels, creatives, or audience segments show inflated short-term lift that reverts to mean within 4–6 weeks. Run tests through at least one complete conversion cycle before drawing conclusions.
- Measuring lift at CVR only — a channel generating 35% CVR lift but equivalent MQL-to-SQL rates adds volume to the CRM without adding revenue potential. Always evaluate lead quality alongside lead quantity.
- One-time testing cadence — audience behavior, market conditions, creative fatigue, and competitive dynamics shift incrementality baselines quarter over quarter. Treating a holdout test as a one-time exercise produces insights with a 6–12 month shelf life at best.
Holdout Testing Best Practices
Programs that generate durable, actionable holdout results operate with institutional discipline, not tactical opportunism.
- Pre-register every test parameter — KPI, MDE, confidence threshold, holdout percentage, test duration, and analysis plan must be documented before the campaign goes live. This eliminates post-hoc rationalization of ambiguous results.
- Test channels in isolation — running holdout tests across multiple simultaneous channel changes makes it statistically impossible to attribute observed lift to any single variable. One test, one channel, one change.
- Integrate CRM holdout tagging from day one — retrofitting cohort attribution after a campaign ends is unreliable. Build holdout/exposed status into the lead capture workflow so pipeline data is available by default.
- Run quarterly, not annually — lift baselines shift with audience saturation, creative fatigue, and seasonality. Quarterly testing cadences catch performance degradation before it compounds into significant budget waste.
- Calibrate MTA models with holdout outputs — use holdout-derived Incremental ROAS to recalibrate multi-touch attribution credit weights by channel. When MTA-reported ROAS and holdout-measured Incremental ROAS diverge by more than 25%, the attribution model requires re-weighting.
- Layer holdout results with MMM — Marketing Mix Modeling provides macro budget guidance; holdout testing provides channel-level causal validation. The two methods are structurally complementary, not competitive.
Frequently Asked Questions
What is the difference between holdout testing and A/B testing?
A/B testing compares two versions of a campaign asset — creative, headline, landing page — within an audience already receiving the campaign to determine which variant performs better. Holdout testing compares a campaign-exposed group against a non-exposed control group to determine whether running the campaign at all drives incremental conversions. A/B testing optimizes what the campaign says; holdout testing determines whether the campaign should run.
How large does the holdout group need to be?
Holdout group size is a function of baseline CVR, target MDE, and required statistical power — not a fixed percentage. For most B2B lead generation programs with 2–3% baseline CVRs and a 20% relative MDE at 95% confidence and 80% power, each cell requires 12,700–19,200 users. The 10–20% holdout convention is a practical starting point, not a statistical requirement.
Does withholding a holdout group cost revenue during the test?
Yes, but the cost is structurally bounded and typically justified. A 10% holdout on a campaign generating $500K in pipeline means at most $50K in potentially deferred pipeline — and only the incremental portion at that. In contrast, continuing to invest in zero-lift channels without holdout validation frequently misallocates 20–40% of total budget, a far larger and recurring loss.
How do you prevent holdout group contamination?
Contamination prevention requires three layers: audience exclusion enforcement at the platform level (suppression lists, excluded custom audiences), ghost ad architecture where supported, and post-test cross-referencing of holdout user IDs against all ad exposure logs and retargeting pixel fires. If contamination exceeds 5–10% of the holdout cell, the measured lift is understated and the test should be flagged as inconclusive.
Can holdout testing be used for always-on lead generation programs?
Yes, but always-on programs require Bayesian adaptive testing frameworks rather than traditional frequentist fixed-window designs. Bayesian methods allow continuous monitoring and result interpretation without inflating false-positive rates — making them structurally suited to programs that cannot pause measurement for a pre-defined test window. For channel-level holdouts in always-on contexts, rotating holdout periods (e.g., two weeks on, two weeks off) provide a time-based alternative.
How does holdout testing interact with multi-touch attribution models?
MTA models assign credit based on touchpoint presence; they cannot establish whether any touchpoint caused the conversion. Holdout testing provides the causal ground truth MTA inherently lacks. The recommended integration: run holdout tests quarterly by channel, then use the resulting Incremental ROAS figures to recalibrate MTA credit weights. Channels where MTA-reported ROAS exceeds holdout-measured Incremental ROAS by 25% or more are over-credited in the model and consuming disproportionate budget.
What happens when holdout test results show zero or negative lift?
Zero lift indicates the channel is not driving incremental conversions beyond the organic baseline — every conversion claimed in attribution reporting would have occurred without the campaign. Negative lift suggests the campaign may be cannibalizing organic conversions (a common finding in over-frequency retargeting). Neither result justifies continued spend at current levels. The appropriate response is to pause or restructure the campaign, then retest after creative refresh or audience reconfiguration.