
- Incrementality testing isolates the net-new leads and conversions a marketing channel actually caused — stripping out the organic baseline that would have converted without any paid activity.
- Standard attribution models overcount channel performance by crediting conversions that were already in-market; incrementality testing corrects that inflation by measuring the true causal lift.
- The output — expressed as incremental lift %, iROAS, or iCPL — gives CMOs a defensible metric for channel investment decisions that reported ROAS cannot provide.
What Is Incrementality Testing?
Incrementality testing is a controlled experimental methodology that measures how many conversions, leads, or pipeline outcomes a marketing channel genuinely caused — above and beyond what would have occurred organically without any campaign exposure.
The central question it answers: if this channel went dark tomorrow, how much lead volume would actually disappear?
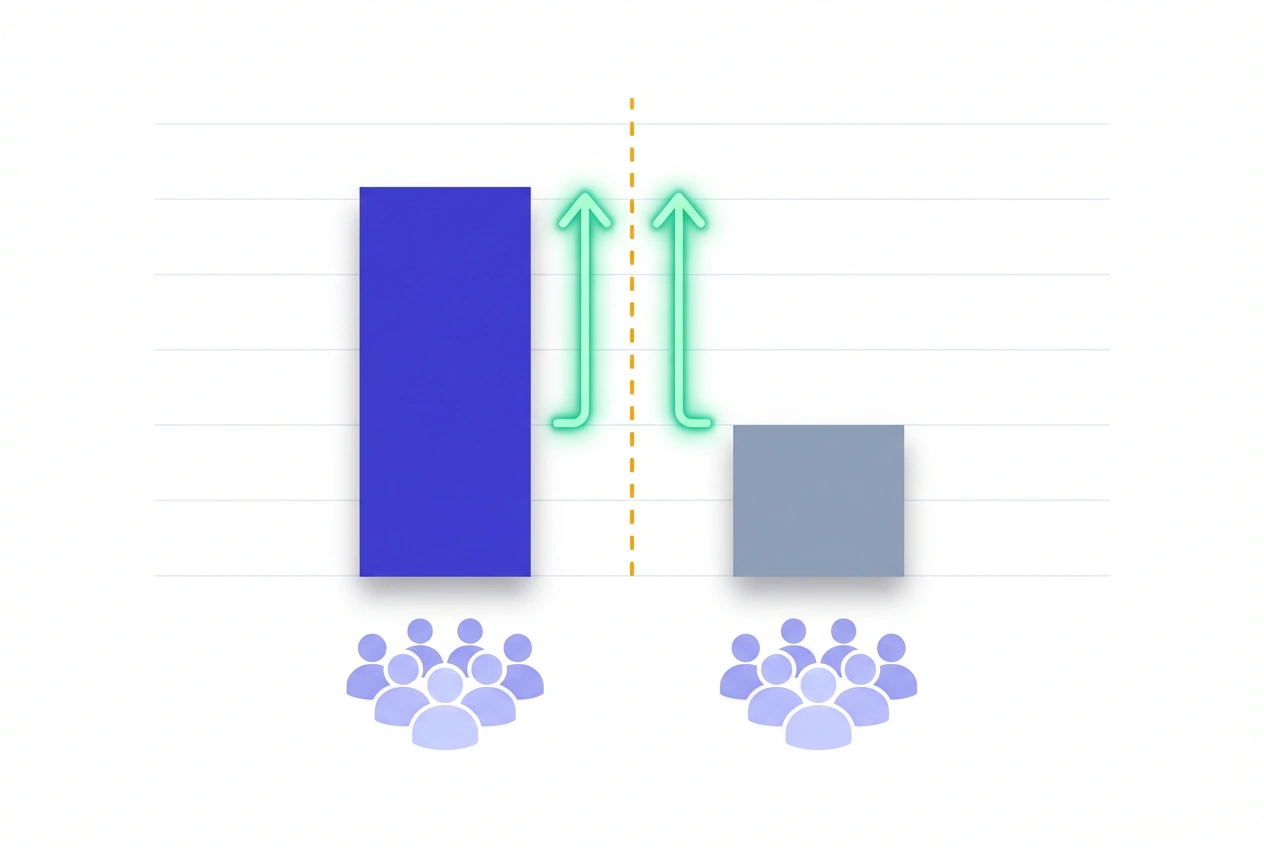
Unlike attribution models that allocate credit to observed touchpoints, incrementality testing compares an exposed group against a matched holdout group that receives no marketing treatment. The conversion delta between the two groups — adjusted for statistical significance — is the true incremental lift: the number of leads, MQLs, or pipeline opportunities the channel created from scratch.
This distinction matters at the budget allocation level. A channel reporting a 4x ROAS in your attribution platform may be delivering a 1.2x incremental ROAS once organic and cross-channel conversions are stripped from the count. Incrementality testing surfaces that gap.
Test LeadSources today. Enter your email below and receive a lead source report showing all the lead source data we track—exactly what you’d see for every lead tracked in your LeadSources account.
How It Works
Every incrementality test is built on one structural principle: divide your audience into two groups before the campaign runs, then compare outcomes after it ends.
The Holdout Group Mechanism
The test cell (exposed group) sees the campaign as normal. The holdout cell (control group) is withheld from all campaign exposure for the duration of the test.
Holdout construction varies by channel and platform:
- User-level holdout: A randomly selected percentage of eligible users (typically 10–20%) are excluded from ad serving at the audience level. Used in Meta Conversion Lift, Google Campaign Experiments, and programmatic DSPs.
- Geo-based holdout: Specific geographic markets are held dark while others receive campaign treatment. Conversion rates are compared across matched market pairs — the industry-standard approach for TV, OOH, and cross-channel programs.
- Ghost bidding: The platform bids in ad auctions for holdout users but deliberately loses, preserving the auction environment without delivering impressions. Eliminates auction dynamic distortion in user-level holdout designs.
- Time-based holdout: Campaign is withheld during a defined “dark” period and compared against an equivalent active period. Weakest design due to confounding from seasonality and demand shifts — use only when audience-level holdout is operationally impossible.
Measuring the Lift
At test conclusion, conversion rates from both groups are compared. The difference — the incremental lift — represents the volume of conversions the campaign caused that would not have existed organically.
Validity of the lift estimate depends on statistical significance testing against the null hypothesis that no difference exists between groups. Results that do not clear a 90–95% confidence threshold should not be actioned.
How to Calculate Incremental Lift
Three metrics govern incrementality measurement. Each serves a distinct decision-making purpose.
Incremental Lift Percentage
The headline metric: how much did campaign exposure improve conversion rate above the organic baseline?
iLift (%) = [(CVR_exposed − CVR_holdout) / CVR_holdout] × 100

Where:
  CVR_exposed  = conversion rate of the test cell (saw campaign)
  CVR_holdout  = conversion rate of the control cell (no campaign)
A 40% iLift means campaign-exposed users converted at a rate 40% higher than users who received no exposure — with that gap attributable to the campaign itself, not to brand demand or cross-channel influence.
Incremental ROAS (iROAS)
The revenue efficiency metric: how much incremental revenue does each dollar of spend generate, excluding organic conversions the channel is incorrectly claiming?
iROAS = Incremental Revenue / Total Ad Spend

Where:
  Incremental Revenue = (CVR_exposed − CVR_holdout) × Exposed Users × Average Deal Value
Reported ROAS consistently overstates channel efficiency because it includes organic conversions in the numerator. iROAS corrects this. A channel showing 3.8x reported ROAS may deliver 1.6x iROAS once holdout data is applied — a signal that organic demand is doing the heavy lifting, not the paid campaign.
Incremental CPL (iCPL)
The cost efficiency metric: what did each net-new lead actually cost to generate?
iCPL = Total Ad Spend / Incremental Leads

Where:
  Incremental Leads = Total Leads (exposed) − Expected Leads (holdout rate × exposed users)
iCPL is the most operationally useful metric for lead generation programs. It reveals the true cost of demand creation, not the blended cost that includes leads who were already converting through organic channels.
Running a Test: Step-by-Step
-
Define your hypothesis and primary success metric.
Specify what you are testing (channel, campaign type, audience segment), the expected direction of effect (positive lift vs. no lift), and the primary outcome metric — MQL volume, iCPL, or downstream SQL rate. Success metrics must be locked before the test begins. Post-hoc metric selection invalidates the experiment. -
Calculate the required sample size before launching.
Use your baseline conversion rate and the minimum detectable effect (MDE) — the smallest lift that would be commercially meaningful — to determine how many users are needed in each cell. For B2B lead generation programs converting at 1–3%, detecting a 20% relative lift at 95% confidence requires approximately 3,500–8,000 users per cell. Running underpowered tests produces noise, not signal. -
Design and instrument your holdout group.
For user-level holdouts, configure the holdout percentage in your ad platform (Meta, Google, DV360) before campaign launch. For geo holdouts, select matched market pairs using pre-period conversion parity as the matching criterion. Ensure your lead attribution platform captures source data at the individual lead level so test-cell and holdout-cell leads can be distinguished in your CRM post-conversion. -
Set and lock the test window.
Minimum test duration: 2 weeks for high-volume consumer programs; 4–8 weeks for B2B programs with longer consideration cycles. The window must span at least one complete business cycle to avoid day-of-week and intra-month demand biases. Do not extend the test window after observing early results — selective stopping inflates false positive rates. -
Measure, validate, and extrapolate.
At test end, compute iLift, iROAS, and iCPL. Run a chi-square or z-test on the conversion rate differential to confirm statistical significance. Validate that pre-experiment conversion rates were balanced between test and holdout cells (the parallel trends check). Then extrapolate the incremental CPL and iROAS to full-funnel pipeline by integrating lead source data from your CRM — MQL-to-SQL rates and deal velocity should be compared between exposed and holdout cohorts, not just top-of-funnel conversion rates.
Common Challenges and How to Solve Them
| Challenge | Root Cause | Solution |
|---|---|---|
| Holdout contamination | Holdout users see organic brand impressions (SEO, social, PR) that create partial exposure | Use geo holdouts where organic impressions are also contained within the test geography |
| Geographic spillover | Users in holdout markets see campaign targeting from adjacent treatment markets | Select geographically isolated market pairs with minimal commuter or cross-border overlap |
| Insufficient sample size | Low lead volume prevents reaching statistical significance within practical test windows | Shift to time-based holdout design or extend geo holdout window; increase holdout percentage to 30–40% |
| Attribution double-counting | CRM or attribution platform credits the incremental lift back to other channels in multi-touch models | Ensure lead source data is tagged at the lead level from holdout test; suppress holdout-cell leads from multi-touch attribution recalculation |
| Novelty effect inflation | Holdout users who are later re-exposed convert at elevated rates due to curiosity, inflating post-test projections | Exclude post-test “reactivation” conversions from incremental lift calculations; measure only within-window outcomes |
Incrementality Testing Best Practices
Operational rigor separates valid incrementality estimates from measurement theater.
- Test at the channel level, not the campaign level. Campaign-level holdouts answer tactical questions (does this creative work?). Channel-level holdouts answer strategic ones (does paid social generate pipeline that organic cannot?). CMO-level budget decisions require channel-level evidence.
- Use iCPL and iROAS as primary KPIs, not reported metrics. Present both reported and incremental metrics in dashboards. The gap between them is a direct measure of how much your attribution model is overcounting channel contribution.
- Instrument your CRM for full-funnel incrementality. A lead-level attribution platform that captures source data through every pipeline stage enables you to measure not just incremental MQL volume but incremental SQL rate, incremental opportunity value, and incremental revenue. Top-of-funnel incrementality alone is insufficient for budget decisions in long-cycle B2B programs.
- Establish an organic baseline before scaling paid activity. Run a 2–4 week dark period at the start of each fiscal year or major campaign launch to measure your baseline organic conversion rate by channel. This baseline is the denominator in every future incremental lift calculation — without it, your iLift estimates carry significant uncertainty.
- Cadence matters. Gartner recommends running incrementality tests on each major channel at least twice per year. Channel incrementality is not static: it shifts with competitive spend levels, audience saturation, and seasonal demand. A channel that delivered 45% iLift in Q1 may deliver 18% by Q3 as audience pools exhaust.
- Do not confuse incrementality with attribution model reform. Incrementality testing validates whether a channel belongs in your mix — it does not replace the need for accurate attribution data at the lead level. Both are required: incrementality for strategic channel investment decisions, attribution for tactical optimization of spend within channels.
Frequently Asked Questions
What is the difference between incrementality testing and A/B testing?
A/B testing compares two creative, messaging, or landing page variants against each other to identify which performs better within an already-running channel. Incrementality testing compares a channel-exposed group against a channel-withheld group to determine whether the channel itself generates net-new outcomes. A/B testing optimizes within a channel; incrementality testing validates whether the channel deserves investment at all.
How large does my lead generation program need to be to run a valid test?
The required sample size depends on your baseline conversion rate and the minimum lift you need to detect. At a 2% baseline conversion rate, detecting a 25% relative lift at 95% confidence requires approximately 5,500 users per cell — meaning an 11,000-user eligible audience minimum. For B2B programs with conversion rates below 1%, geo-based holdout designs are more practical, using market-level conversion volume rather than user-level counts to achieve sufficient statistical power.
How does incrementality testing relate to marketing mix modeling (MMM)?
MMM estimates channel contribution using historical spend-to-revenue regression across the entire media mix — it is observational and operates at aggregate level. Incrementality testing is experimental and operates at the user or market level, producing channel-specific causal lift estimates. The two approaches are complementary: MMM provides strategic channel mix direction; incrementality tests validate those estimates at the campaign level with controlled experimental evidence.
Can I use incrementality testing to measure lead quality, not just volume?
Yes — and this is where lead-level attribution data becomes critical. By tagging each lead with their holdout-cell or test-cell membership and passing that data into your CRM, you can compare MQL-to-SQL conversion rates, average deal size, and pipeline velocity between the two groups. This reveals whether the incremental leads a channel produces are high-quality SQLs or low-intent MQLs — a distinction that top-of-funnel lift percentages completely obscure.
What is a realistic incremental lift benchmark by channel?
Benchmarks vary significantly by industry, audience saturation, and program maturity. Based on Analytic Partners and Nielsen research: paid search typically delivers 40–65% iLift relative to organic baseline; paid social ranges from 15–45% depending on audience overlap with organic channels; display and programmatic generally range from 5–25%, with the lower end common in high-brand-awareness categories where organic demand is already strong. These are directional norms — your baseline, audience quality, and creative effectiveness will determine your specific iLift ceiling.
How do I report incrementality testing results to the board?
Frame results around three numbers: the reported metric (what your attribution platform says), the incremental metric (what the holdout test says), and the overcount gap (the difference between them expressed as a percentage). A channel showing 38% overcount in attributed conversions means 38 cents of every reported dollar of channel performance is organic demand the channel is incorrectly claiming credit for. This framing makes incrementality results immediately legible to finance and C-suite audiences without requiring statistical fluency.
Does incrementality testing work for outbound and SDR-driven lead programs?
Yes, with a modified holdout design. For SDR programs, randomly assign target accounts to treatment (receive outbound sequences) and control (no outbound contact) cells from your total addressable account list. Compare MQL conversion rates and pipeline generated across both cells at the end of the test window. The incremental lift of the outbound program is the net conversion rate above what the control accounts generated through inbound channels alone — directly answering whether SDR investment is creating demand or just capturing it earlier in the buying cycle.