Do you run LinkedIn ads but can’t identify which ad is responsible for your leads, sales, and revenue?
While you may have visibility into the total number of leads generated by each LinkedIn ad, you lack the ability to analyze data at the individual lead level.
As a result, you can’t tell which LinkedIn ad produced the leads that became customers, making it challenging to optimize your budget.
Leadsources solves this problem.
The solution to this problem lies in Leadsources, which captures your LinkedIn ads data (campaign, audience, ad, etc.) down to the lead level.
LinkedIn ad data, including campaign, audience, and ad for each lead, can be comprehensively stored in Fillout.
You can then create reports, like “Ads that generated the most leads,” to decide which ad to promote or stop.
Let’s dive straight into it!
Capture LinkedIn ads in Fillout
Step 1: Add Leadsources in the head tag of your website

Sign up to Leadsources.io, and benefit from our 14-day free trial.
Position the Leadsources tracking code in the head tag of your website.
No code is necessary, follow this easy step-by-step guide.
Step 2: Add the UTM parameters to your LinkedIn campaigns

Input the UTM parameters you’d like to track in all your LinkedIn ads (campaign, audience, ad, etc.).
Example: You could include these UTM parameters in the links of your LinkedIn ads:
- UTM_source
- UTM_campaign
- UTM_term
- UTM_content
Be informed that Leadsources collects lead source data like channel, landing page, and landing page subfolder, even if you don’t use UTM parameters, to ensure a comprehensive overview of your leads source at the lead level.
Step 3: Add the hidden fields in Fillout

When someone completes your Fillout form, Leadsources automatically fills the hidden fields with LinkedIn ads data (campaign, audience, ad, etc.).
Use our in-depth guide to add hidden fields in Fillout to successfully complete the setup.
The LinkedIn ads data is saved directly into your Fillout form by Leadsources (see Step 4 for details).
Step 4: Capture the LinkedIn ads data in Fillout

Leadsources gathers LinkedIn ad details (campaign, ad set, audience, ad, etc.) when a visitor clicks on your LinkedIn ad and accesses your website.
Leadsources ensures the LinkedIn ads data is automatically included in the hidden fields of your Fillout form.
Upon submission of the form, the LinkedIn ads data, along with the form’s answers, is sent to the Fillout submissions page for each generated lead.
How does Leadsources work?
Integrating the Leadsources tracking code into your site’s head tag enables you to capture LinkedIn ads data (campaign, audience, ad, etc.) each time a visitor arrives on your website.
The LinkedIn ads data is then inserted into the hidden fields of your Fillout form.
Leadsources will extract the following visitor data:
- Channel
- Source
- Campaign
- Content
- Term
- Landing page
- Landing page subfolder
This enables you to keep an eye on key lead source details even when UTM parameters can’t be implemented, for example, when your traffic is generated from organic sources like:
- Google Search
- Instagram bio link
- Social media posts
- Etc.
While many tools capture lead data solely with UTM parameters, Leadsources operates efficiently even when no UTM parameters are present, ensuring reliable tracking of your lead source.
Hence, unlike other tools, Leadsources gathers lead data from all channels:
- Organic Search
- Paid Search
- Organic Social
- Paid Social
- Referral
- Affiliate
- Display Advertising
- Direct Traffic
This enables you to track and compile all lead source data into one central place.
Pro tip:
Track LinkedIn ads in your favorite online form builder, including Cognito Forms, Gravity Forms, Jotform, Typeform, or WPForms. Using another online form builder? Check our guide on how to track LinkedIn ads in your form.
How to run performance reports
With your LinkedIn ads data stored in Fillout, you can now create performance reports such as:
- Leads per campaign
- Leads per Ad set
- Leads per audience
- Leads per ad
- Etc.
This supports you in making better choices regarding your LinkedIn budget.
Let’s consider the different report types you can put together.
1. Lead performance reports
Reports can be run to reflect the quantity of leads generated through:
- Channel
- Campaign
- Ad set
- Audience
- Ad
- Landing page
- Landing page subfolder
Example #1
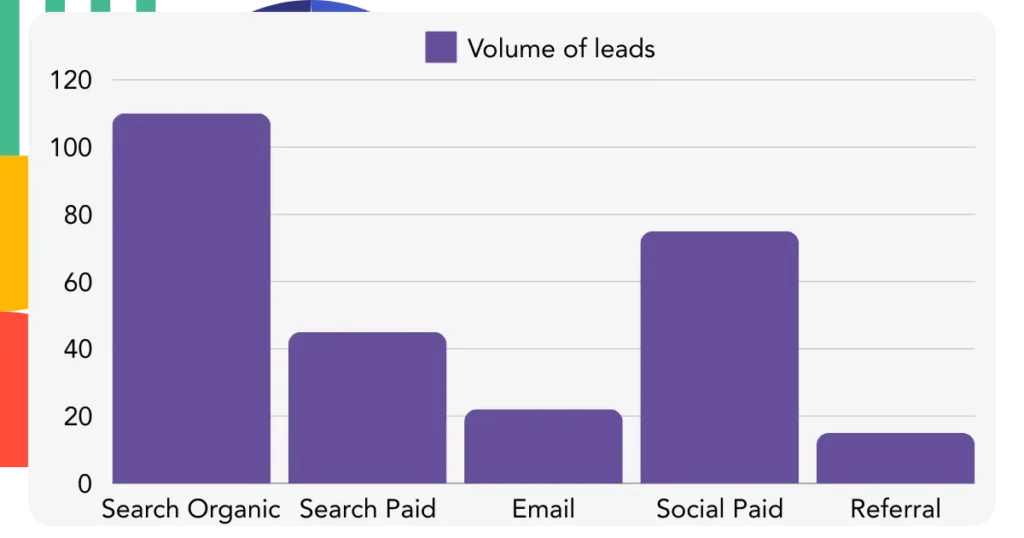
You can pull data from campaigns in various channels (SEO, Social Paid, Email, etc.) and develop a report titled “Leads by Channel.”

Example #2
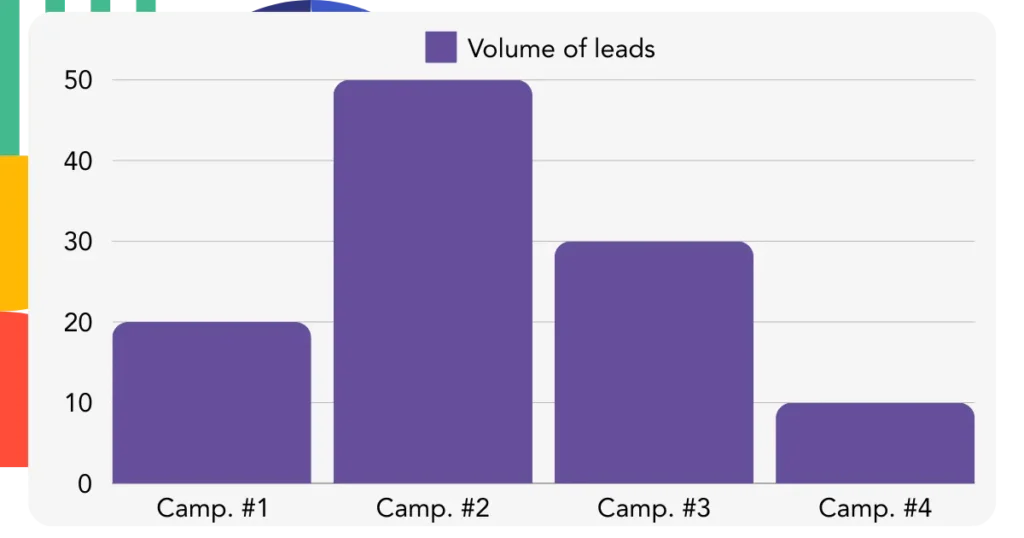
Once you find the top-performing channel (e.g., LinkedIn ads), you can concentrate on it to view the number of leads from individual campaigns.

Example #3
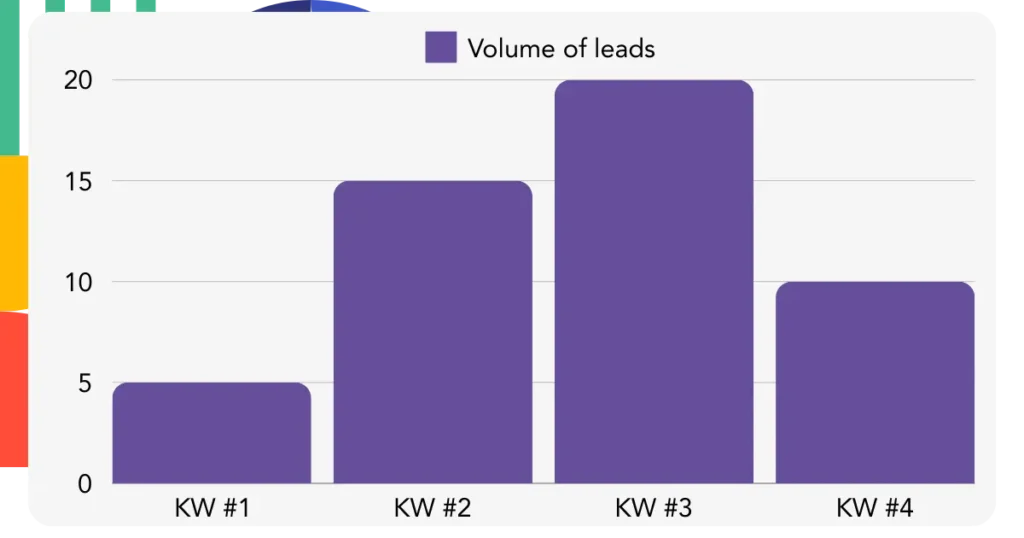
After you find the campaign that leads in generation, you can look into which particular LinkedIn audience, campaign, or ad is responsible for these results.

2. Sales performance report
Recognizing the LinkedIn ads and audiences that yielded the highest number of leads is essential. Yet, does this mean that these leads also influence your sales and revenue?
By loading your Fillout data into a CRM (like GoHighLevel), you can ascertain which leads turned into paying customers, facilitating the development of sales reports from your LinkedIn ads data (campaign, ad, audience, etc.).
Refer to this example:
| Channels | Search Paid | Social Paid |
| Leads | 50 | 75 |
| Sales | 5 | 6 |
| Average order value | $150 | $100 |
| Revenue | $750 | $600 |
Upon analyzing the advertising campaigns on Google and LinkedIn, the initial “Leads by Channel” report showed that LinkedIn’s Social Paid ads produced a higher number of leads than Search Paid ads.
After investigating your sales and revenue data from the CRM export, you discovered that the Search Paid channel resulted in higher revenue with fewer leads compared to the Social Paid channel, highlighting a possible need to increase the Search Paid budget.
Furthermore, you can generate multiple reports that focus on assessing sales and revenue performance:
- Sales and revenue by source
- Sales and revenue by campaign
- Sales and revenue by content (aka. ad)
- Sales and revenue by term (aka. audience)
- Sales and revenue by landing page
- Sales and revenue by landing page subfolder
LeadSources tracks the source of each lead in Fillout, whether they come from ads, organic search, social, email, etc. and syncs that data with each submission. See the full breakdown on the lead source in Fillout page.

