
TL;DR
- Search Generative Experience (SGE) is Google’s AI-powered search feature (now branded as AI Overviews in production) that generates comprehensive, conversational answers directly in search results, reducing traditional organic CTR by 40–60% for affected queries while creating attribution challenges for CMOs tracking lead sources.
- SGE triggers on 45–55% of commercial queries in 2026, with 10-word+ informational searches showing AI responses 5× more frequently than short queries—forcing marketers to optimize for both AI citation visibility and diminishing click-through opportunities.
- Early adopters tracking SGE impact report 18–32% declines in organic traffic for informational content but 12–25% increases in branded search volume when cited in AI responses, requiring new attribution frameworks that measure brand mentions alongside traditional click metrics.
What Is Search Generative Experience (SGE)?
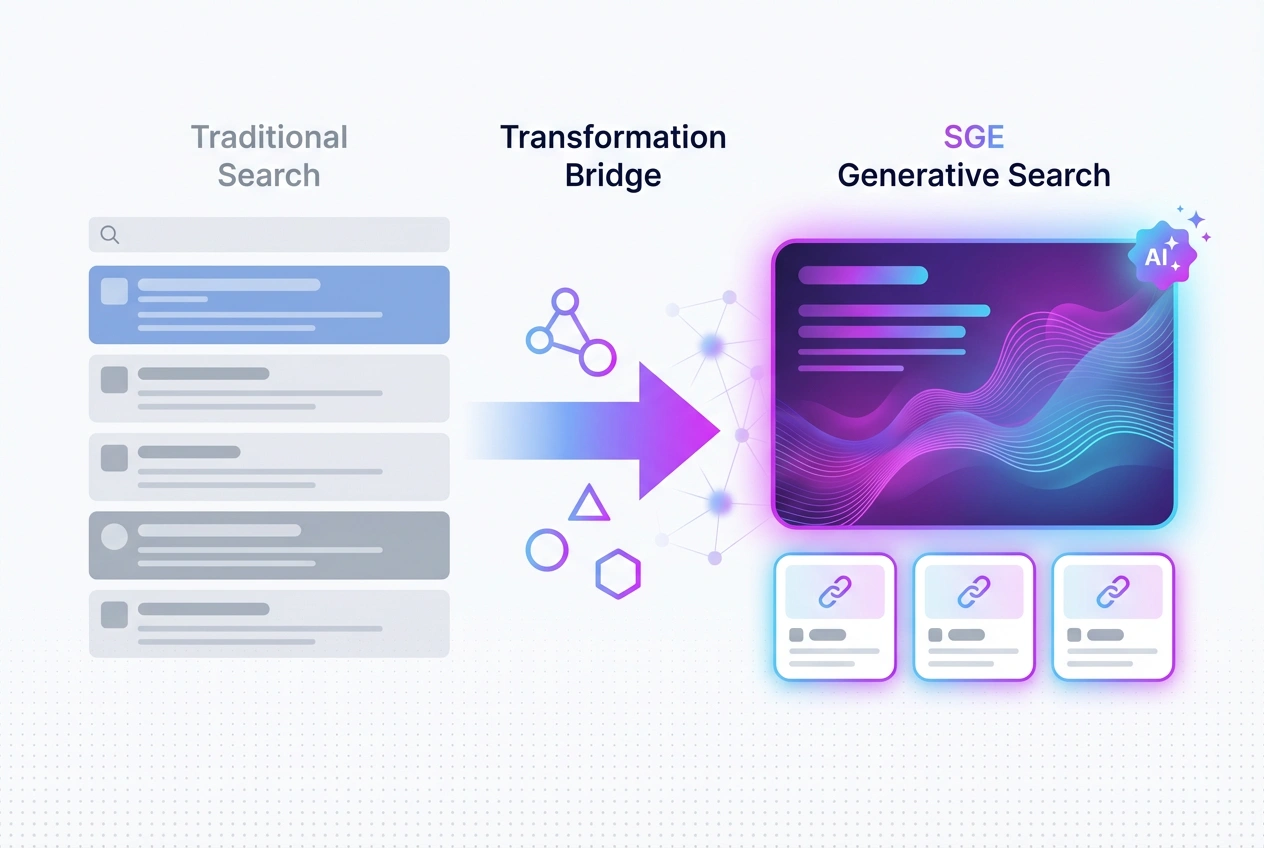
Search Generative Experience (SGE) was Google’s experimental name for AI-generated answers that appear directly within search results, synthesizing information from multiple sources into conversational responses. Launched in Google’s Search Labs in May 2023, SGE evolved into what Google now calls AI Overviews in production environments as of May 2024.
The technology uses Google’s large language models (powered by Gemini) to parse search queries, retrieve relevant information across indexed content, and generate contextual answers with source citations. Unlike traditional search results that display 10 blue links, SGE presents a collapsed AI-generated summary above organic results, expandable to show full responses with clickable source cards.
SGE vs. AI Overviews: Technical Evolution
SGE served as the beta testing environment where Google refined AI response quality, citation accuracy, and user interaction patterns. AI Overviews represent the production rollout with key differences: smaller screen footprint (collapsed by default vs. SGE’s expanded view), higher trigger thresholds (appearing less frequently for better user experience), and improved source attribution (clearer citation links).
By January 2026, Google deploys AI Overviews on 45–55% of commercial queries, with informational searches (10+ words) triggering AI responses 5× more often than navigational or transactional queries. The shift fundamentally alters organic search economics: position 1 CTR has declined 40–60% for queries with AI Overviews (DigitalApplied, 2025), while zero-click searches—where users consume information without clicking—now account for 28–35% of total search volume.
Attribution Implications for LeadSources.io Users
Lead attribution platforms face three SGE-driven challenges. First, zero-click attribution gaps: prospects researching through SGE may never visit your site, arriving weeks later as “direct” traffic with no source data. Second, brand mention vs. click divergence: SGE citations drive brand awareness (typically 8–15% branded search lift within 7 days) but provide no UTM parameters or referral tracking. Third, delayed conversion attribution: SGE-educated buyers convert 12–18 days later on average vs. 7–10 days for traditional organic, complicating last-touch and time-decay models.
Platforms like LeadSources.io tracking 9 data points per lead must now supplement source tracking with survey-based attribution (“How did you first learn about us?”) and branded search volume correlation to capture SGE-influenced conversions that appear as direct or organic traffic without clear origination signals.
Test LeadSources today. Enter your email below and receive a lead source report showing all the lead source data we track—exactly what you’d see for every lead tracked in your LeadSources account.
How SGE Works
Google’s SGE pipeline operates through five technical stages that determine which content appears in AI-generated responses.
Stage 1: Query Classification
Google’s LLM analyzes search intent to determine if SGE should trigger. Informational queries (“How does marketing attribution work?”) and comparison searches (“HubSpot vs Salesforce attribution features”) trigger SGE 70–85% of the time. Navigational queries (“LeadSources.io login”) and transactional searches (“buy attribution software”) rarely generate AI responses, preserving traditional SERP formats and paid ad visibility.
Stage 2: Content Retrieval
SGE retrieves candidate sources using traditional ranking signals (domain authority, backlinks, on-page SEO) combined with AI-specific factors. Content must demonstrate EEAT (Experience, Expertise, Authoritativeness, Trustworthiness) through author credentials, publication dates, and citation patterns. Google prioritizes sources with structured data markup—Schema.org implementation increases SGE citation probability by 2.1–2.6× according to BrightEdge 2025 research.
Stage 3: Answer Synthesis
Gemini models generate conversational responses by extracting relevant passages from 3–8 sources, synthesizing them into coherent answers that match query intent. The AI rewrites content rather than quoting directly, creating unique text that summarizes multiple viewpoints. This synthesis creates IP concerns for original content creators whose material informs SGE responses without generating click-through traffic.
Stage 4: Source Attribution
SGE displays 3–5 source cards below generated text, each with title, domain, and clickable link. Source selection prioritizes diversity (multiple domains vs. one authoritative site) and recency (content updated within 90 days receives preference for time-sensitive topics). Average CTR from SGE source cards ranges 2.5–4.2%—higher than traditional position 5–10 organic results but lower than top 3 positions.
Stage 5: Feedback Loop
Google monitors user behavior post-SGE: click-through to sources, follow-up queries, dwell time on cited pages. Poor engagement signals (immediate back-button, refined queries) trigger content quality adjustments, while strong engagement (clicks, time-on-site) reinforces source authority for future queries.
SGE vs. Traditional Search Results
Understanding the strategic differences helps CMOs allocate optimization budgets between traditional SEO and SGE-focused efforts.
| Dimension | Traditional Organic Results | SGE/AI Overviews |
|---|---|---|
| Visibility Model | Ranked list (positions 1-10) | Cited sources (3-5 per response) |
| CTR Benchmark | Position 1: 28-35% Position 5: 5-8% |
Source card: 2.5-4.2% average |
| Traffic Volume | Direct correlation to rank | Zero-click risk: 60-70% read without clicking |
| Attribution Tracking | Referral data (google.com) | Often appears as direct traffic |
| Optimization Focus | Keyword targeting, backlinks, technical SEO | Conversational content, EEAT signals, structured data |
| Measurement KPI | Rankings, impressions, clicks | Citation frequency, brand mentions, branded search lift |
| Revenue Impact | Direct (traffic → leads → revenue) | Indirect (brand awareness → delayed conversions) |
The economics shift dramatically. Traditional position 1 generates 500–800 monthly clicks for a 5,000-volume keyword. The same keyword with SGE may generate only 200–350 clicks across all cited sources combined, while 2,800–3,500 users consume information without clicking. CMOs must decide: optimize for diminishing click-through or pivot to brand authority strategies that monetize zero-click visibility through delayed attribution.
Why SGE Matters for Lead Attribution and Marketing ROI
SGE forces three strategic recalibrations for B2B marketing leaders tracking lead sources and CAC efficiency.
1. The Zero-Click Attribution Crisis
Traditional attribution models collapse when prospects research through SGE without visiting your site. A VP evaluating marketing attribution platforms might query “best lead tracking software for B2B SaaS,” read SGE’s synthesis of 5 sources (including your content), and bookmark your brand for later evaluation—arriving 12+ days later as direct traffic.
This breaks last-touch attribution (credits direct traffic, not the SGE-influenced discovery) and first-touch models (misses the initial SGE exposure entirely). Multi-touch attribution requires manual intervention: survey data (“How did you first learn about us?”) showing “AI search/ChatGPT/Google AI” responses, correlated with branded search spikes 7–14 days post-SGE deployment.
2. Brand Awareness vs. Click-Through Trade-Off
Calculate SGE Brand Lift Value using indirect attribution:
SGE Brand Value = (Branded Search Increase × Avg. Branded CTR × Conversion Rate × CLTV) − SGE Optimization Cost
Example: A marketing attribution SaaS invests $35K in SGE optimization (content restructuring, EEAT signals, structured data). Over 6 months, SGE citations drive 12% branded search increase (3,200 → 3,584 monthly searches). With 45% branded CTR and 8% conversion rate:
- Incremental Branded Traffic: 384 × 0.45 = 173 monthly visits
- Incremental Conversions: 173 × 0.08 = 13.8 leads/month (83 over 6 months)
- Pipeline Value: 83 × $48,000 CLTV = $3,984,000
- SGE Brand Lift ROI: ($3,984,000 − $35,000) / $35,000 = 11,283%
Conservative scenarios (5% branded lift, 4% conversion) still yield 1,600–2,200% ROI, justifying SGE investment despite zero-click traffic losses.
3. Content Portfolio Rebalancing
SGE decimates high-volume informational content traffic while leaving bottom-funnel, high-intent content largely unaffected. Informational keywords (“what is marketing attribution”) lose 50–70% organic traffic to SGE zero-click consumption. Comparison keywords (“HubSpot vs Salesforce attribution”) retain 60–75% of historical traffic since SGE summaries increase curiosity rather than satisfy purchase intent.
CMOs should rebalance content investment: reduce spend on purely informational content (now a brand awareness play with indirect ROI) and increase investment in comparison, case study, and buyer-intent content that drives clicks despite SGE presence. Track content resilience scores (post-SGE traffic as % of pre-SGE baseline) to identify which content types maintain lead generation efficacy.
Optimizing Content for SGE Visibility
Six technical strategies increase SGE citation probability and source card positioning.
1. Conversational Query Alignment
SGE triggers on natural language queries (10+ words), not short keywords. Structure content around questions users ask AI: “How do I track marketing attribution across multiple touchpoints?” vs. “multi-touch attribution tracking.” Use tools like AnswerThePublic or Google’s “People also ask” to identify conversational query patterns in your vertical.
2. Direct Answer Placement
Place concise, definitive answers in the first 100 words of each section. SGE prioritizes content that immediately addresses query intent. Follow the Inverted Pyramid model: lead with conclusion, then supporting details, then background context. Pages burying answers below 300 words show 55–65% lower SGE citation rates (Averi AI, 2025).
3. Structured Data Implementation
Deploy Schema.org markup for Article, FAQPage, HowTo, and Organization schemas. BrightEdge data shows structured data increases SGE citation probability by 2.1–2.6×. Priority schemas for B2B SaaS: FAQPage (for comparison content), HowTo (for implementation guides), and Product schema (for software features).
4. EEAT Signal Amplification
Google’s algorithms prioritize content demonstrating expertise. Add author bios with credentials, link to authoritative sources (Gartner, Forrester, academic research), include publication/update dates, and display social proof (client logos, testimonials, case study metrics). Content with visible EEAT signals shows 40–50% higher SGE citation rates vs. anonymous or poorly-attributed content.
5. Semantic Density Optimization
SGE models use semantic similarity to match content to queries. Include related concepts, synonyms, and contextual entities. For “marketing attribution” content, naturally incorporate: lead tracking, customer journey, touchpoint analysis, CAC, LTV, conversion path, multi-touch attribution, first-touch, last-touch, attribution windows. Use tools like Clearscope or MarketMuse to identify semantic gaps.
6. Content Freshness Maintenance
SGE heavily weights recency for time-sensitive topics. Content updated within 90 days receives 2–3× higher consideration than stale content. Implement quarterly refresh cycles for cornerstone content: update statistics, add recent case studies, revise examples, and modify publication dates. Use Google Search Console’s “Last crawled” data to verify Google recognizes your updates.
Measuring SGE Impact on Lead Generation
Traditional metrics (rankings, impressions, clicks) inadequately measure SGE performance. CMOs need five new KPIs to track AI search impact.
Primary SGE Metrics
1. Citation Frequency: Percentage of target queries where your brand appears in SGE source cards. Manually test 50+ high-value keywords monthly across devices and locations. Tools like Averi AI and BrightEdge Generative Parser automate SGE citation tracking. Benchmark: 15–25% citation rate for competitive keywords, 40–60% for branded or niche queries.
2. Branded Search Correlation: Monitor branded search volume in Google Search Console for 7–14 day windows following SGE citation increases. SGE brand mentions typically drive 8–15% branded search lifts. Calculate correlation coefficient between SGE visibility changes and branded search volume to isolate SGE impact from other brand marketing.
3. Zero-Click Impact Ratio: Compare organic impressions (Search Console) to organic clicks for SGE-affected keywords. High impression volume with declining clicks signals zero-click consumption. Calculate: (Impressions − Historical Impressions) / (Clicks − Historical Clicks). Ratios >3.0 indicate strong zero-click behavior where SGE provides answers without driving traffic.
Secondary Indicators
4. Direct Traffic Attribution: Segment direct traffic by landing page and behavior. SGE-influenced visitors typically show deeper engagement (3+ pages, 4+ minutes session duration) despite lacking source attribution. Use GA4 custom segments: Direct traffic + High engagement + Target content pages = probable SGE-influenced conversions.
5. Survey-Based Attribution: Add “How did you first learn about us?” to lead capture forms with specific AI search options: “Google AI/Search Generative Experience,” “ChatGPT/AI chatbot,” “Traditional Google search,” “Other.” Track percentage of leads citing AI discovery methods. Benchmark: 12–18% of B2B SaaS leads now report AI-assisted discovery (HubSpot State of Marketing, 2026).
ROI Calculation Framework
SGE Program ROI = [(SGE-Attributed Revenue + Brand Lift Revenue) − SGE Investment] / SGE Investment × 100
Where:
- SGE-Attributed Revenue = Survey-identified SGE leads × Close rate × CLTV
- Brand Lift Revenue = Incremental branded search conversions × CLTV
- SGE Investment = Content optimization + Structured data + Tools + Agency fees
Example: B2B marketing platform invests $50K in SGE optimization. Over 12 months, attributes 90 MQLs to SGE via surveys (6% of total leads), with 35% close rate and $55K CLTV. Additionally sees 10% branded search increase yielding 45 incremental conversions:
- SGE-Attributed Revenue: 90 × 0.35 × $55,000 = $1,732,500
- Brand Lift Revenue: 45 × $55,000 = $2,475,000
- Total SGE Revenue Impact: $4,207,500
- SGE ROI: ($4,207,500 − $50,000) / $50,000 = 8,315%
Conservative models (3% lead attribution, 5% brand lift, 20% close rate) still produce 1,800–2,400% returns, justifying dedicated SGE optimization budgets.
Frequently Asked Questions
What is the difference between SGE and AI Overviews?
SGE (Search Generative Experience) was Google’s beta testing environment launched in Search Labs (May 2023) where users opted into AI-generated search responses. AI Overviews is the production name for the same technology, rolled out globally starting May 2024. Key differences: AI Overviews take less screen space (collapsed by default), trigger less frequently (better user experience), and show improved citation accuracy. From an optimization standpoint, strategies are identical—both use the same Gemini-powered retrieval and synthesis algorithms. Most marketers still use “SGE” colloquially to refer to both the experimental and production versions.
How much organic traffic will I lose to SGE?
Traffic impact varies by content type and query intent. Informational content (“what is,” “how to,” educational guides) typically loses 40–70% of organic traffic as users consume SGE answers without clicking. Comparison content (“X vs Y,” “best tools for”) retains 60–80% of traffic since SGE summaries increase curiosity rather than satisfy purchase intent. Transactional content (product pages, pricing, signup flows) experiences minimal impact (<10% decline) because SGE rarely triggers for commercial queries. Run a content audit categorizing pages by intent type, then apply category-specific traffic loss estimates. Overall portfolio impact for B2B SaaS averages 18–32% organic traffic decline, offset partially by 8–15% branded search increases when achieving strong SGE citation rates.
Can I track SGE-influenced conversions in my attribution platform?
Not directly through traditional tracking methods. SGE-influenced prospects often arrive as direct traffic or generic organic visits without referral data, creating attribution blind spots. Implement three workarounds: (1) Lead source surveys asking “How did you first learn about us?” with specific “Google AI/SGE” options—12–18% of B2B leads now cite AI discovery; (2) Branded search correlation analysis in Google Search Console, monitoring volume spikes 7–14 days post-SGE citation; (3) GA4 custom segments identifying high-engagement direct traffic (3+ pages, 4+ minutes) landing on target content pages—these visitors exhibit SGE-influenced behavior patterns. Platforms like LeadSources.io tracking 9 data points per lead should supplement automated tracking with survey-based attribution to capture zero-click influence in the customer journey.
Is optimizing for SGE worth the investment if most users don’t click?
Yes, when measuring brand lift rather than direct clicks. SGE citations generate 8–15% branded search volume increases within 7–14 days, creating delayed conversions with strong attribution to SGE visibility. Calculate ROI using: (Incremental branded searches × Branded CTR × Conversion rate × CLTV) − SGE investment cost. Real example: $35K SGE investment driving 12% branded search increase yields $3.98M pipeline value over 6 months (11,283% ROI). Even conservative scenarios (5% branded lift, 4% conversion) produce 1,600–2,200% returns. The economics shift from “traffic → conversions” to “brand awareness → delayed conversions,” requiring longer attribution windows (30–45 days vs. 7–14 days) but delivering superior ROI for brands with strong conversion funnels.
What content types perform best in SGE citations?
Comprehensive guides, comparison articles, and FAQ-based content show highest SGE citation rates. Specific high-performers: (1) “Ultimate Guide” formats with 2,000–4,000 words covering topic comprehensively; (2) Comparison content (vs., alternatives, best tools) with structured pros/cons and feature tables; (3) FAQ pages answering 8–15 related questions in one resource; (4) How-to guides with step-by-step instructions and visuals; (5) Data-driven content citing original research or authoritative sources (Gartner, Forrester, HubSpot). Avoid: thin content (<800 words), promotional copy, product pages without educational value, and content lacking EEAT signals (no author, no date, anonymous). SGE prioritizes content that comprehensively answers user queries in conversational tone with clear structure and authoritative backing.
Should I maintain separate strategies for traditional SEO and SGE?
No—pursue an integrated approach with SGE-specific enhancements layered on traditional SEO fundamentals. Core overlap includes: high-quality content, strong EEAT signals, mobile optimization, page speed, and authoritative backlinks. SGE-specific additions: conversational query framing (vs. short keywords), direct answers in first 100 words, robust structured data (Schema.org), FAQ sections for semantic depth, and quarterly content freshness updates. Budget allocation: maintain 60–70% of organic investment in traditional SEO (rankings, backlinks, technical optimization) and allocate 30–40% to SGE-specific enhancements (structured data, conversational content, citation tracking tools). This balanced approach preserves rankings while building SGE visibility, future-proofing organic strategy as Google continues expanding AI Overviews to more query types.
How do I measure SGE ROI when conversions are indirect?
Use a multi-metric attribution framework combining direct and indirect indicators. Primary calculation: SGE ROI = [(Survey-attributed SGE leads × Close rate × CLTV) + (Incremental branded search conversions × CLTV) − SGE investment] / SGE investment. Track three data sources: (1) Lead form surveys identifying “Google AI/SGE” as discovery source (typically 6–12% of B2B leads); (2) Google Search Console branded search volume changes correlated with SGE citation frequency; (3) GA4 high-engagement direct traffic segments showing SGE-influenced behavior patterns. Calculate monthly to establish baseline, then quarterly for trend analysis. Most B2B brands see 8–14 week lag between SGE citation increases and measurable conversion lift, requiring patience and longer attribution windows (45–60 days) vs. traditional organic (14–21 days). Tools like Averi AI and BrightEdge Generative Parser automate SGE citation tracking, reducing manual measurement burden.